备注
Go to the end 下载完整的示例代码。
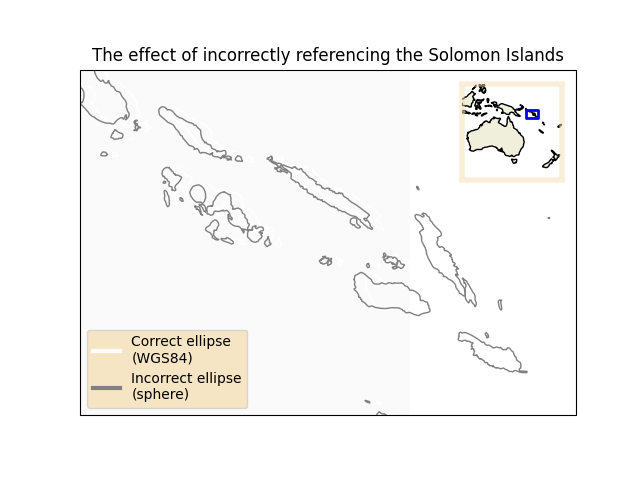
错误引用椭圆的效果#
此示例演示了将数据引用到错误椭圆的效果。
首先,我们定义两个坐标系-一个使用1984年建立的世界大地测量系统,另一个使用球体。接下来,我们从自然地球陆地数据集中提取数据,并将大地坐标(WGS 84中引用)转换为我们定义的相应坐标系。最后,我们将这些数据集绘制到地图上,假设它们都引用WGS 84椭圆,并比较海岸线因引用错误椭圆而发生的移动情况。
from matplotlib.lines import Line2D as Line
from matplotlib.patheffects import Stroke
import matplotlib.pyplot as plt
import numpy as np
import shapely.geometry as sgeom
from shapely.ops import transform as geom_transform

import cartopy.crs as ccrs
import cartopy.feature as cfeature
from cartopy.io.img_tiles import GoogleTiles


def transform_fn_factory(target_crs, source_crs):
    """
    Return a function which can be used by ``shapely.op.transform``
    to transform the coordinate points of a geometry.

    The function explicitly *does not* do any interpolation or clever
    transformation of the coordinate points, so there is no guarantee
    that the resulting geometry would make any sense.

    """
    def transform_fn(x, y, z=None):
        new_coords = target_crs.transform_points(source_crs,
                                                 np.asanyarray(x),
                                                 np.asanyarray(y))
        return new_coords[:, 0], new_coords[:, 1], new_coords[:, 2]

    return transform_fn


def main():
    # Define the two coordinate systems with different ellipses.
    wgs84 = ccrs.PlateCarree(globe=ccrs.Globe(ellipse='WGS84'))
    sphere = ccrs.PlateCarree(globe=ccrs.Globe(ellipse='sphere'))

    # Define the coordinate system of the data we have from Natural Earth and
    # acquire the 1:10m physical coastline shapefile.
    geodetic = ccrs.Geodetic(globe=ccrs.Globe(datum='WGS84'))
    dataset = cfeature.NaturalEarthFeature(category='physical',
                                           name='coastline',
                                           scale='10m')

    # Create an image tiler instance, and use its CRS for the GeoAxes.
    tiler = GoogleTiles(style="satellite")
    fig = plt.figure()
    ax = fig.add_subplot(1, 1, 1, projection=tiler.crs)
    ax.set_title('The effect of incorrectly referencing the Solomon Islands')

    # Pick the area of interest. In our case, roughly the Solomon Islands, and
    # get hold of the coastlines for that area.
    extent = [155, 163, -11.5, -6]
    ax.set_extent(extent, geodetic)
    geoms = list(dataset.intersecting_geometries(extent))

    # Add the aerial imagery at zoom level 7.
    ax.add_image(tiler, 7)

    # Transform the geodetic coordinates of the coastlines into the two
    # projections of differing ellipses.
    wgs84_geoms = [geom_transform(transform_fn_factory(wgs84, geodetic),
                                  geom) for geom in geoms]
    sphere_geoms = [geom_transform(transform_fn_factory(sphere, geodetic),
                                   geom) for geom in geoms]

    # Using these differently referenced geometries, assume that they are
    # both referenced to WGS84.
    ax.add_geometries(wgs84_geoms, wgs84, edgecolor='white', facecolor='none')
    ax.add_geometries(sphere_geoms, wgs84, edgecolor='gray', facecolor='none')

    # Create a legend for the coastlines.
    legend_artists = [Line([0], [0], color=color, linewidth=3)
                      for color in ('white', 'gray')]
    legend_texts = ['Correct ellipse\n(WGS84)', 'Incorrect ellipse\n(sphere)']
    legend = ax.legend(legend_artists, legend_texts, fancybox=True,
                       loc='lower left', framealpha=0.75)
    legend.legendPatch.set_facecolor('wheat')

    # Create an inset GeoAxes showing the location of the Solomon Islands.
    sub_ax = fig.add_axes([0.7, 0.625, 0.2, 0.2],
                          projection=ccrs.PlateCarree())
    sub_ax.set_extent([110, 180, -50, 10], geodetic)

    # Make a nice border around the inset axes.
    effect = Stroke(linewidth=4, foreground='wheat', alpha=0.5)
    sub_ax.spines['geo'].set_path_effects([effect])

    # Add the land, coastlines and the extent of the Solomon Islands.
    sub_ax.add_feature(cfeature.LAND)
    sub_ax.coastlines()
    extent_box = sgeom.box(extent[0], extent[2], extent[1], extent[3])
    sub_ax.add_geometries([extent_box], ccrs.PlateCarree(), facecolor='none',
                          edgecolor='blue', linewidth=2)

    plt.show()


if __name__ == '__main__':
    main()
Total running time of the script: (16分二十七点二二二秒)
Gallery generated by Sphinx-Gallery _