备注
Go to the end 下载完整的示例代码。
网格线和勾号标签#
这些示例演示了如何在非矩形投影上快速添加经度和纬度网格线以及标记标签。
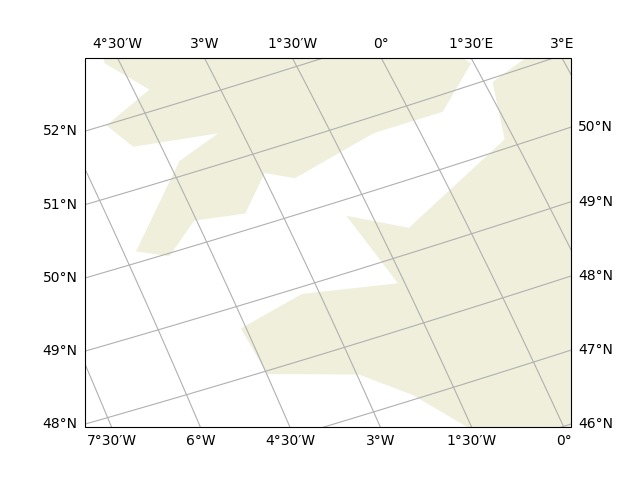
正如您在第一个示例中看到的那样,经度标签可能会画在左侧和右侧,纬度标签可能会画在底部和顶部。感谢 dms 关键字,在适当时使用分钟来显示度的分数。
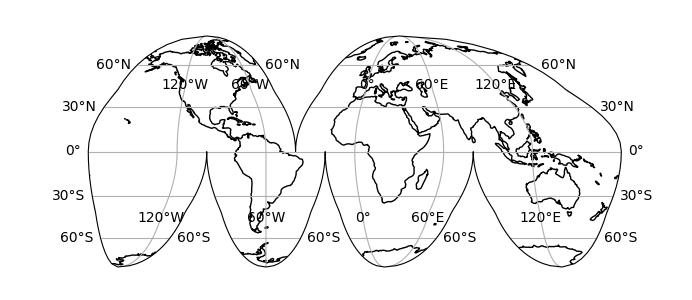
在第二个示例中,尽管其复杂性,标签仍然绘制在地图边缘,并且一些其他标签也绘制在地图边界内。
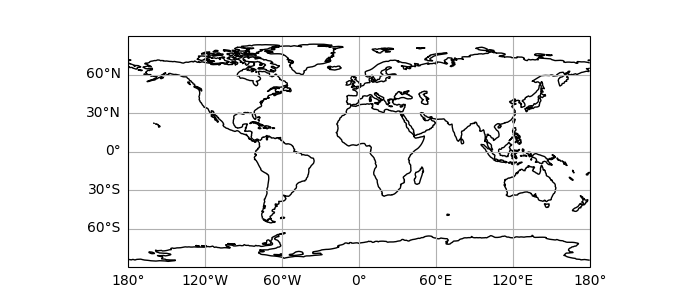
在第三个示例中,标签仅在左侧和底部绘制。
import matplotlib.pyplot as plt

import cartopy.crs as ccrs
import cartopy.feature as cfeature


def main():

    rotated_crs = ccrs.RotatedPole(pole_longitude=120.0, pole_latitude=70.0)
    ax0 = plt.axes(projection=rotated_crs)
    ax0.set_extent([-6, 1, 47.5, 51.5], crs=ccrs.PlateCarree())
    ax0.add_feature(cfeature.LAND.with_scale('110m'))
    ax0.gridlines(draw_labels=True, dms=True, x_inline=False, y_inline=False)

    plt.figure(figsize=(6.9228, 3))
    ax1 = plt.axes(projection=ccrs.InterruptedGoodeHomolosine())
    ax1.coastlines(resolution='110m')
    ax1.gridlines(draw_labels=True)

    plt.figure(figsize=(7, 3))
    ax2 = plt.axes(projection=ccrs.PlateCarree())
    ax2.coastlines(resolution='110m')
    gl = ax2.gridlines(draw_labels=True)
    gl.top_labels = False
    gl.right_labels = False
    plt.show()


if __name__ == '__main__':
    main()
Total running time of the script: (0分0.721秒)
Gallery generated by Sphinx-Gallery _