备注
Go to the end 下载完整的示例代码。
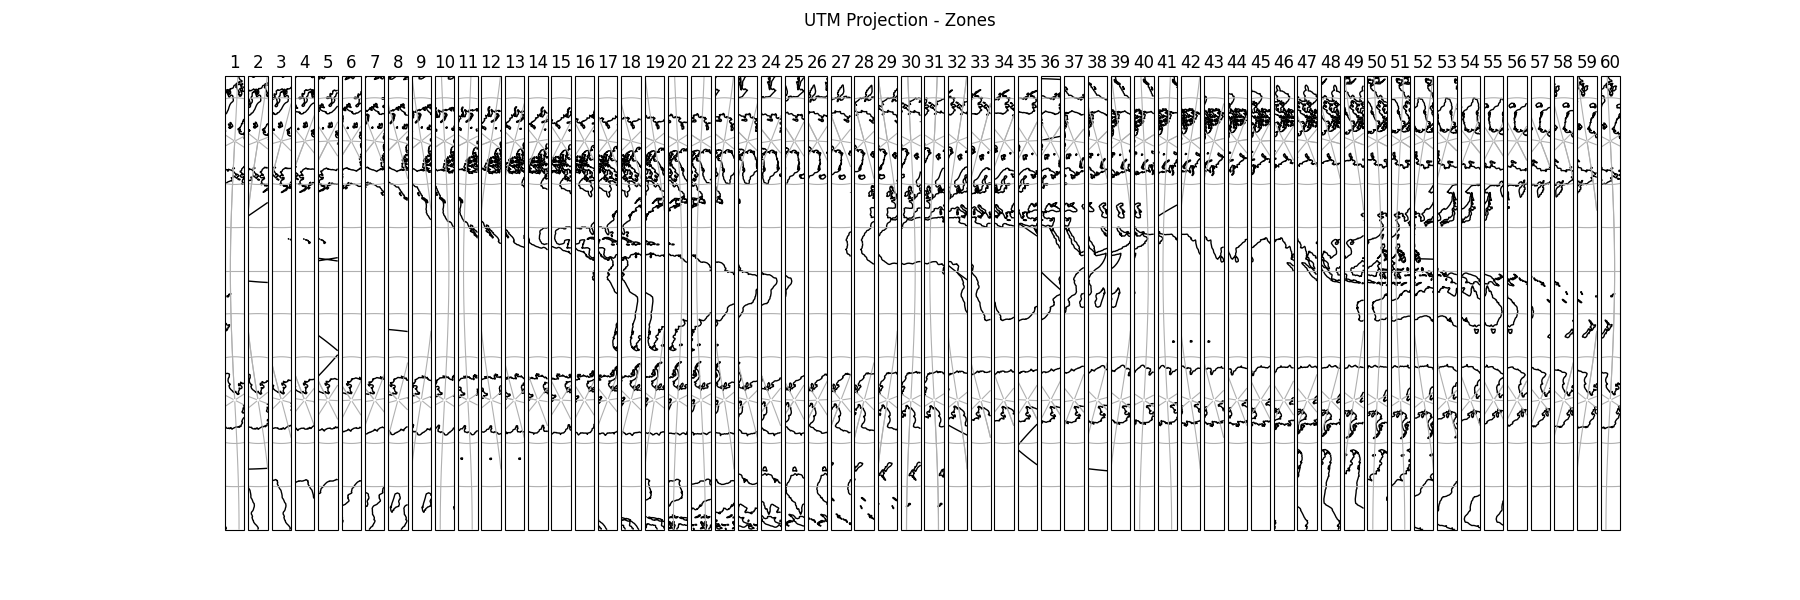
初始化UTM投影的所有60个区域#
此示例在图形中将通用横轴墨卡托投影的所有60个区域彼此相邻地显示。
首先,我们创建一个在一行中包含60个子图的图形。接下来,我们将图中每个轴的投影设置到特定的UTM区域。然后我们添加海岸线、网格线和区域数量。最后添加一个超级标题并显示图形。
import matplotlib.pyplot as plt

import cartopy.crs as ccrs


def main():
    # Create a list of integers from 1 - 60
    zones = range(1, 61)

    # Create a figure
    fig = plt.figure(figsize=(18, 6))

    # Loop through each zone in the list
    for zone in zones:

        # Add GeoAxes object with specific UTM zone projection to the figure
        ax = fig.add_subplot(1, len(zones), zone,
                             projection=ccrs.UTM(zone=zone,
                                                 southern_hemisphere=True))

        # Add coastlines, gridlines and zone number for the subplot
        ax.coastlines(resolution='110m')
        ax.gridlines()
        ax.set_title(zone)

    # Add a supertitle for the figure
    fig.suptitle("UTM Projection - Zones")

    # Display the figure
    plt.show()


if __name__ == '__main__':
    main()
Total running time of the script: (0分35.713秒)
Gallery generated by Sphinx-Gallery _