备注
Go to the end 下载完整的示例代码。
自定义边界形状#
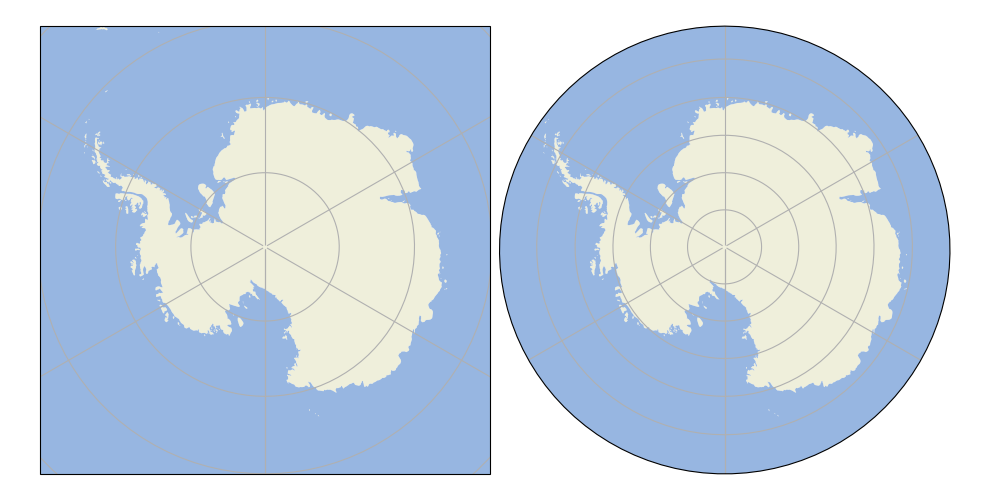
This example demonstrates how a custom shape geometry may be used instead of the projection's default boundary.
在这种情况下,我们将边界定义为轴坐标中的圆。这意味着无论地图本身的范围如何,边界始终是一个圆。
import matplotlib.path as mpath
import matplotlib.pyplot as plt
import numpy as np

import cartopy.crs as ccrs
import cartopy.feature as cfeature


def main():
    fig = plt.figure(figsize=[10, 5])
    ax1 = fig.add_subplot(1, 2, 1, projection=ccrs.SouthPolarStereo())
    ax2 = fig.add_subplot(1, 2, 2, projection=ccrs.SouthPolarStereo(),
                          sharex=ax1, sharey=ax1)
    fig.subplots_adjust(bottom=0.05, top=0.95,
                        left=0.04, right=0.95, wspace=0.02)

    # Limit the map to -60 degrees latitude and below.
    ax1.set_extent([-180, 180, -90, -60], ccrs.PlateCarree())

    ax1.add_feature(cfeature.LAND)
    ax1.add_feature(cfeature.OCEAN)

    ax1.gridlines()
    ax2.gridlines()

    ax2.add_feature(cfeature.LAND)
    ax2.add_feature(cfeature.OCEAN)

    # Compute a circle in axes coordinates, which we can use as a boundary
    # for the map. We can pan/zoom as much as we like - the boundary will be
    # permanently circular.
    theta = np.linspace(0, 2*np.pi, 100)
    center, radius = [0.5, 0.5], 0.5
    verts = np.vstack([np.sin(theta), np.cos(theta)]).T
    circle = mpath.Path(verts * radius + center)

    ax2.set_boundary(circle, transform=ax2.transAxes)

    plt.show()


if __name__ == '__main__':
    main()
Total running time of the script: (0分5.023秒)
Gallery generated by Sphinx-Gallery _