
备注
Go to the end 下载完整的示例代码。
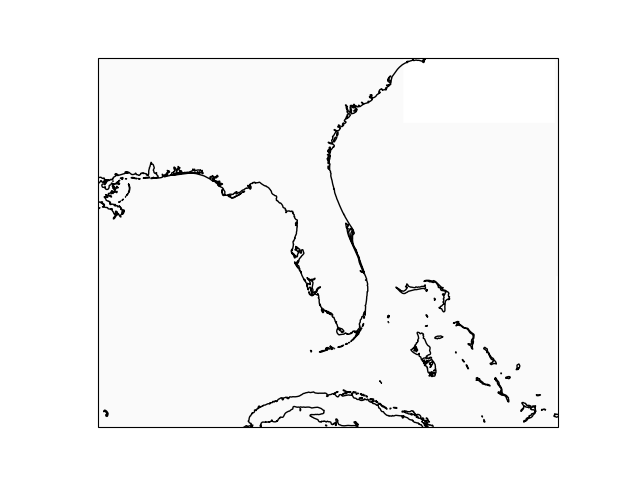
网络磁贴图像#
此示例演示了如何访问来自提供Web服务的磁贴的图像。
import matplotlib.pyplot as plt

import cartopy.crs as ccrs
from cartopy.io.img_tiles import GoogleTiles


def main():
    tiler = GoogleTiles(style="satellite")
    mercator = tiler.crs

    fig = plt.figure()
    ax = fig.add_subplot(1, 1, 1, projection=mercator)
    ax.set_extent([-90, -73, 22, 34], crs=ccrs.PlateCarree())

    ax.add_image(tiler, 6)

    ax.coastlines('10m')
    plt.show()


if __name__ == '__main__':
    main()
Total running time of the script: (16分钟26.839秒)
Gallery generated by Sphinx-Gallery _