备注
单击 here 要下载完整的示例代码,请执行以下操作
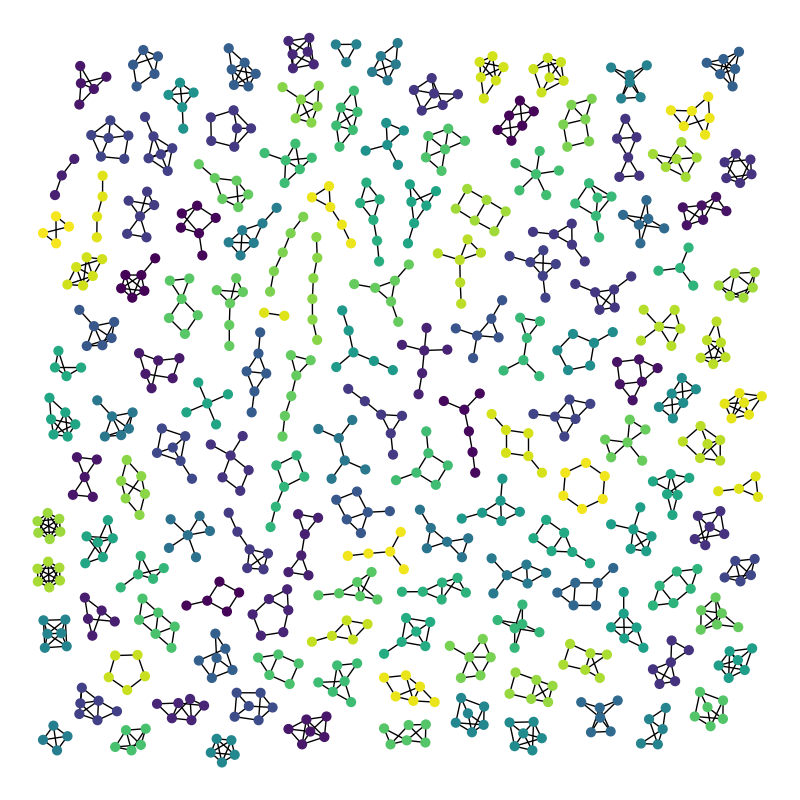
阿特拉斯#
包含最多6个节点的所有连接图形的图集。
本例通过PyGraphviz使用Graphviz。
图像应显示142个图形。我们既不绘制空图,也不绘制单节点图。(142是序列oeis.org/A001349中的值2到n=6的总和)。
出:
Graph named 'G208' with 809 nodes and 1112 edges
142 connected components
import random

import matplotlib.pyplot as plt
import networkx as nx


GraphMatcher = nx.isomorphism.vf2userfunc.GraphMatcher


def atlas6():
    """Return the atlas of all connected graphs with at most 6 nodes"""

    Atlas = nx.graph_atlas_g()[3:209]  # 0, 1, 2 => no edges. 208 is last 6 node graph
    U = nx.Graph()  # graph for union of all graphs in atlas
    for G in Atlas:
        # check if connected
        if nx.number_connected_components(G) == 1:
            # check if isomorphic to a previous graph
            if not GraphMatcher(U, G).subgraph_is_isomorphic():
                U = nx.disjoint_union(U, G)
    return U


G = atlas6()

print(G)
print(nx.number_connected_components(G), "connected components")

plt.figure(1, figsize=(8, 8))
# layout graphs with positions using graphviz neato
pos = nx.nx_agraph.graphviz_layout(G, prog="neato")
# color nodes the same in each connected subgraph
C = (G.subgraph(c) for c in nx.connected_components(G))
for g in C:
    c = [random.random()] * nx.number_of_nodes(g)  # random color...
    nx.draw(g, pos, node_size=40, node_color=c, vmin=0.0, vmax=1.0, with_labels=False)
plt.show()
Total running time of the script: ( 0 minutes 3.227 seconds)