备注
单击 here 要下载完整的示例代码,请执行以下操作
使用OSMnx的OpenStreetMap#
此示例说明如何使用OSMnx从OpenStreetMap下载街道网络并对其建模、可视化中心性以及将图形另存为shapefile、GeoPackage或GraphML。
OSMnx是一个Python包,用于将OpenStreetMap街道网络作为NetworkX MultiDiGraph对象进行检索、建模、分析和可视化。它还可以从OSM中检索任何其他空间数据,如geopandas GeoDataFrames。有关https://osmnx.readthedocs.io/的文档和用法,请参阅OSMnx。
import networkx as nx
import osmnx as ox
ox.config(use_cache=True, log_console=True)
# download street network data from OSM and construct a MultiDiGraph model
G = ox.graph_from_point((37.79, -122.41), dist=750, network_type="drive")
# impute edge (driving) speeds and calculate edge traversal times
G = ox.add_edge_speeds(G)
G = ox.add_edge_travel_times(G)
# you can convert MultiDiGraph to/from geopandas GeoDataFrames
gdf_nodes, gdf_edges = ox.graph_to_gdfs(G)
G = ox.graph_from_gdfs(gdf_nodes, gdf_edges, graph_attrs=G.graph)
# convert MultiDiGraph to DiGraph to use nx.betweenness_centrality function
# choose between parallel edges by minimizing travel_time attribute value
D = ox.utils_graph.get_digraph(G, weight="travel_time")
# calculate node betweenness centrality, weighted by travel time
bc = nx.betweenness_centrality(D, weight="travel_time", normalized=True)
nx.set_node_attributes(G, values=bc, name="bc")
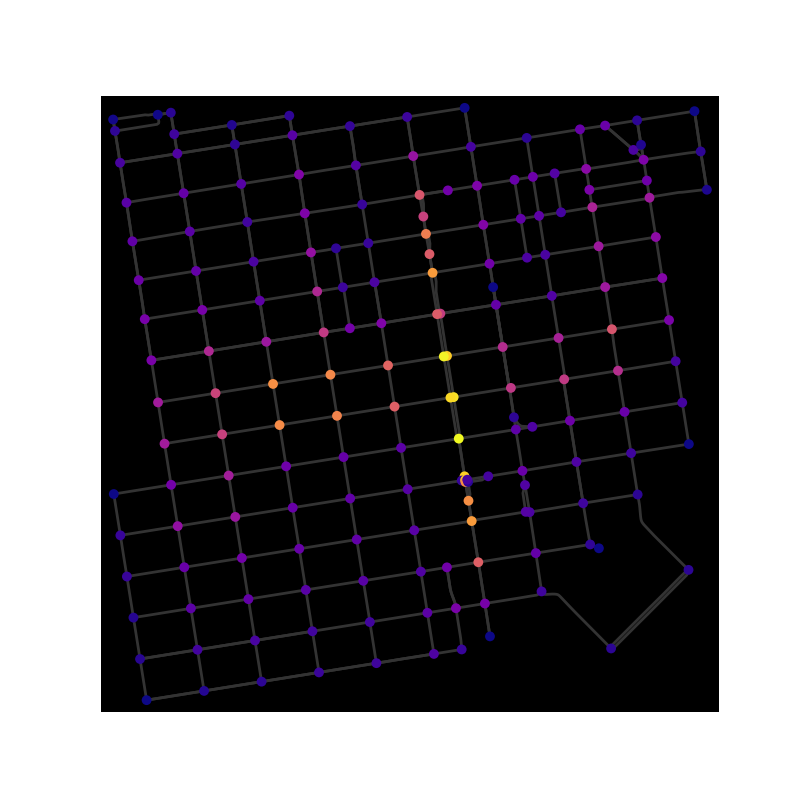
# plot the graph, coloring nodes by betweenness centrality
nc = ox.plot.get_node_colors_by_attr(G, "bc", cmap="plasma")
fig, ax = ox.plot_graph(
G, bgcolor="k", node_color=nc, node_size=50, edge_linewidth=2, edge_color="#333333"
)
# save graph to shapefile, geopackage, or graphml
ox.save_graph_shapefile(G, filepath="./graph_shapefile/")
ox.save_graph_geopackage(G, filepath="./graph.gpkg")
ox.save_graphml(G, filepath="./graph.graphml")
Total running time of the script: ( 0 minutes 12.706 seconds)