备注
点击 here 下载完整的示例代码
谱嵌入#
Spectral 布局基于图的特征向量来定位图的节点laplacian\(L=D-A\),其中\(A\)是邻接矩阵,\(D\)是图的度数矩阵。默认情况下, Spectral 布局将图形嵌入二维(您可以使用 dim 其中一个的参数 draw_spectral() 或 spectral_layout() )
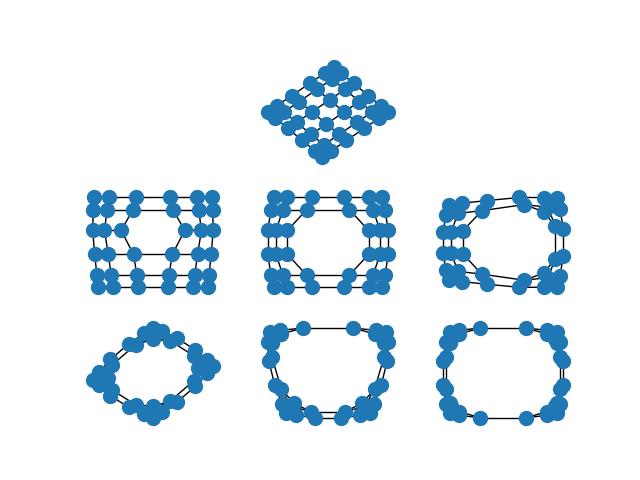
当图的边缘表示事件节点之间的相似性时,谱嵌入将使相似性很高的节点彼此靠近,而不是相似性较低的节点。
这在你壮观地嵌入一个网格图时尤其引人注目。在全网格图中,图中心的节点被拉开的次数多于外围的节点。当您删除内部节点时,这种效果会增加。
import matplotlib.pyplot as plt
import networkx as nx


options = {"node_color": "C0", "node_size": 100}

G = nx.grid_2d_graph(6, 6)
plt.subplot(332)
nx.draw_spectral(G, **options)

G.remove_edge((2, 2), (2, 3))
plt.subplot(334)
nx.draw_spectral(G, **options)

G.remove_edge((3, 2), (3, 3))
plt.subplot(335)
nx.draw_spectral(G, **options)

G.remove_edge((2, 2), (3, 2))
plt.subplot(336)
nx.draw_spectral(G, **options)

G.remove_edge((2, 3), (3, 3))
plt.subplot(337)
nx.draw_spectral(G, **options)

G.remove_edge((1, 2), (1, 3))
plt.subplot(338)
nx.draw_spectral(G, **options)

G.remove_edge((4, 2), (4, 3))
plt.subplot(339)
nx.draw_spectral(G, **options)

plt.show()
Total running time of the script: ( 0 minutes 0.175 seconds)