备注
单击 here 要下载完整的示例代码,请执行以下操作
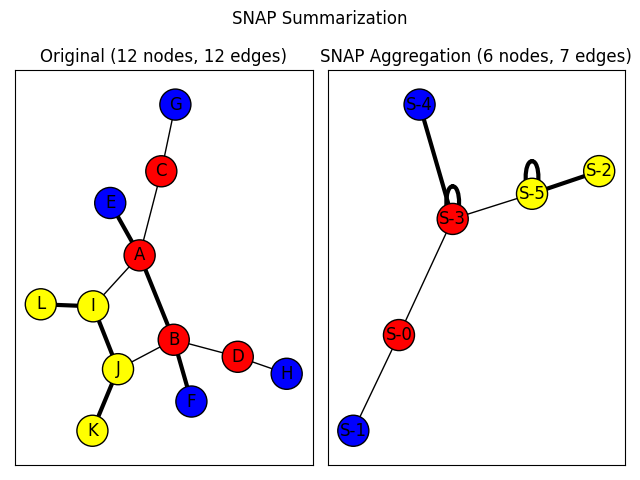
捕捉图摘要#
使用按属性分组节点和成对边汇总(SNAP)算法(不要与斯坦福网络分析项目混淆)根据节点属性和边属性汇总图表的示例。该算法根据节点属性值和边类型与其他节点组的唯一组合对节点进行分组,以生成摘要图。然后可以使用汇总图来推断具有不同属性值的节点如何与图中的其他节点相关。
import networkx as nx
import matplotlib.pyplot as plt


nodes = {
    "A": dict(color="Red"),
    "B": dict(color="Red"),
    "C": dict(color="Red"),
    "D": dict(color="Red"),
    "E": dict(color="Blue"),
    "F": dict(color="Blue"),
    "G": dict(color="Blue"),
    "H": dict(color="Blue"),
    "I": dict(color="Yellow"),
    "J": dict(color="Yellow"),
    "K": dict(color="Yellow"),
    "L": dict(color="Yellow"),
}
edges = [
    ("A", "B", "Strong"),
    ("A", "C", "Weak"),
    ("A", "E", "Strong"),
    ("A", "I", "Weak"),
    ("B", "D", "Weak"),
    ("B", "J", "Weak"),
    ("B", "F", "Strong"),
    ("C", "G", "Weak"),
    ("D", "H", "Weak"),
    ("I", "J", "Strong"),
    ("J", "K", "Strong"),
    ("I", "L", "Strong"),
]
original_graph = nx.Graph()
original_graph.add_nodes_from(n for n in nodes.items())
original_graph.add_edges_from((u, v, {"type": label}) for u, v, label in edges)


plt.suptitle("SNAP Summarization")

base_options = dict(with_labels=True, edgecolors="black", node_size=500)

ax1 = plt.subplot(1, 2, 1)
plt.title(
    "Original (%s nodes, %s edges)"
    % (original_graph.number_of_nodes(), original_graph.number_of_edges())
)
pos = nx.spring_layout(original_graph, seed=7482934)
node_colors = [d["color"] for _, d in original_graph.nodes(data=True)]

edge_type_visual_weight_lookup = {"Weak": 1.0, "Strong": 3.0}
edge_weights = [
    edge_type_visual_weight_lookup[d["type"]]
    for _, _, d in original_graph.edges(data=True)
]

nx.draw_networkx(
    original_graph, pos=pos, node_color=node_colors, width=edge_weights, **base_options
)

node_attributes = ("color",)
edge_attributes = ("type",)
summary_graph = nx.snap_aggregation(
    original_graph, node_attributes, edge_attributes, prefix="S-"
)

plt.subplot(1, 2, 2)

plt.title(
    "SNAP Aggregation (%s nodes, %s edges)"
    % (summary_graph.number_of_nodes(), summary_graph.number_of_edges())
)
summary_pos = nx.spring_layout(summary_graph, seed=8375428)
node_colors = []
for node in summary_graph:
    color = summary_graph.nodes[node]["color"]
    node_colors.append(color)

edge_weights = []
for edge in summary_graph.edges():
    edge_types = summary_graph.get_edge_data(*edge)["types"]
    edge_weight = 0.0
    for edge_type in edge_types:
        edge_weight += edge_type_visual_weight_lookup[edge_type["type"]]
    edge_weights.append(edge_weight)

nx.draw_networkx(
    summary_graph,
    pos=summary_pos,
    node_color=node_colors,
    width=edge_weights,
    **base_options
)

plt.tight_layout()
plt.show()
Total running time of the script: ( 0 minutes 0.133 seconds)