备注
点击 here 下载完整的示例代码
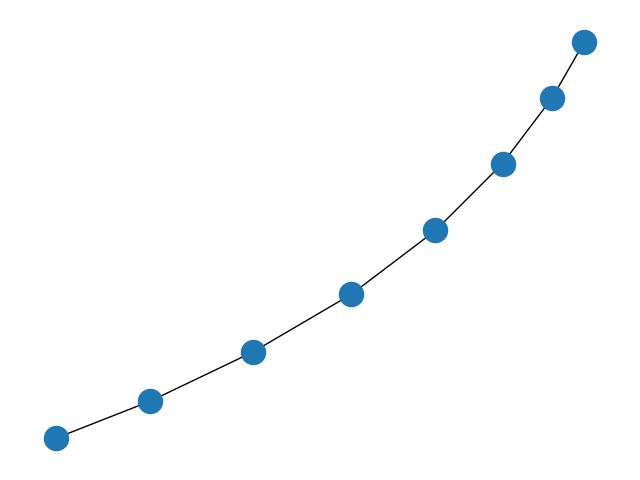
用matplotlib绘制一个图表。
import matplotlib.pyplot as plt
import networkx as nx

G = nx.path_graph(8)
pos = nx.spring_layout(G, seed=47)  # Seed layout for reproducibility
nx.draw(G, pos=pos)
plt.show()
Total running time of the script: ( 0 minutes 0.047 seconds)
Gallery generated by Sphinx-Gallery