备注
点击 here 下载完整的示例代码
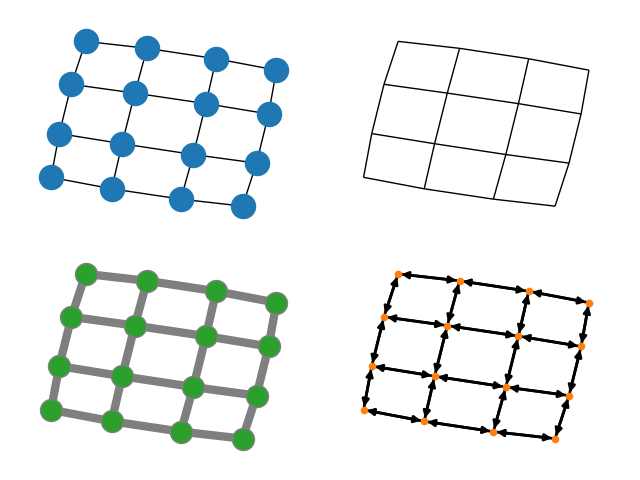
四网格#
使用matplotlib绘制4x4图形。
此示例说明如何使用关键字参数 networkx.draw 自定义包含4x4网格的简单图形的可视化。
import matplotlib.pyplot as plt
import networkx as nx

G = nx.grid_2d_graph(4, 4)  # 4x4 grid

pos = nx.spring_layout(G, iterations=100, seed=39775)

# Create a 2x2 subplot
fig, all_axes = plt.subplots(2, 2)
ax = all_axes.flat

nx.draw(G, pos, ax=ax[0], font_size=8)
nx.draw(G, pos, ax=ax[1], node_size=0, with_labels=False)
nx.draw(
    G,
    pos,
    ax=ax[2],
    node_color="tab:green",
    edgecolors="tab:gray",  # Node surface color
    edge_color="tab:gray",  # Color of graph edges
    node_size=250,
    with_labels=False,
    width=6,
)
H = G.to_directed()
nx.draw(
    H,
    pos,
    ax=ax[3],
    node_color="tab:orange",
    node_size=20,
    with_labels=False,
    arrowsize=10,
    width=2,
)

# Set margins for the axes so that nodes aren't clipped
for a in ax:
    a.margins(0.10)
fig.tight_layout()
plt.show()
Total running time of the script: ( 0 minutes 0.256 seconds)