备注
单击 here 要下载完整的示例代码,请执行以下操作
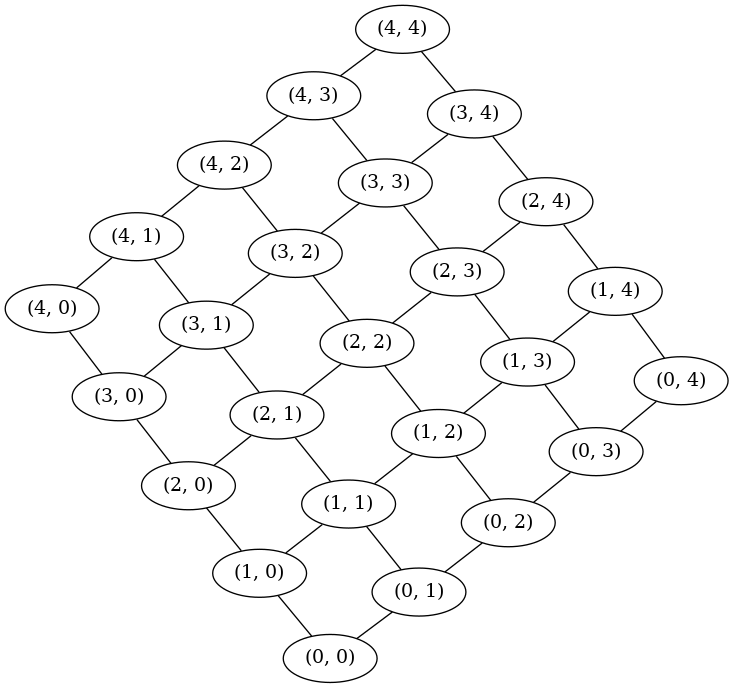
二维网格#
插图 write_dot 与Graphviz命令行界面结合使用以创建可视化效果。
import matplotlib.pyplot as plt
import networkx as nx
从networkx图中写入一个点文件,以便进一步使用graphviz进行处理。
G = nx.grid_2d_graph(5, 5)  # 5x5 grid
# This example needs Graphviz and PyGraphviz
nx.nx_agraph.write_dot(G, "grid.dot")
# Having created the dot file, graphviz can be invoked via the command line
# to generate an image on disk, e.g.
print("Now run: neato -Tps grid.dot >grid.ps")

# Alternatively, the and image can be created directly via AGraph.draw
A = nx.nx_agraph.to_agraph(G)
A.draw("5x5.png", prog="neato")
出:
Now run: neato -Tps grid.dot >grid.ps
Total running time of the script: ( 0 minutes 0.059 seconds)