几何操作#
地貌熊猫 使中几何操作的所有工具都可用 shapely library 。
请注意,使用两个不同空间数据集之间的关系创建新形状的所有集合论工具的文档--如创建交集或差异--可以在 set operations 佩奇。
施工方法#
仿射变换#
- GeoSeries.scale(self, xfact=1.0, yfact=1.0, zfact=1.0, origin='center')#
缩放的几何图形
GeoSeries沿着每个(x,y,z)维。
几何操作的示例#
>>> import geopandas
>>> from geopandas import GeoSeries
>>> from shapely.geometry import Polygon
>>> p1 = Polygon([(0, 0), (1, 0), (1, 1)])
>>> p2 = Polygon([(0, 0), (1, 0), (1, 1), (0, 1)])
>>> p3 = Polygon([(2, 0), (3, 0), (3, 1), (2, 1)])
>>> g = GeoSeries([p1, p2, p3])
>>> g
0         POLYGON ((0 0, 1 0, 1 1, 0 0))
1    POLYGON ((0 0, 1 0, 1 1, 0 1, 0 0))
2    POLYGON ((2 0, 3 0, 3 1, 2 1, 2 0))
dtype: geometry
一些地理操作返回正常的熊猫对象。这个 area 对象的属性 GeoSeries 将返回一个 pandas.Series 中的每一项的面积。 GeoSeries :
>>> print(g.area)
0    0.5
1    1.0
2    1.0
dtype: float64
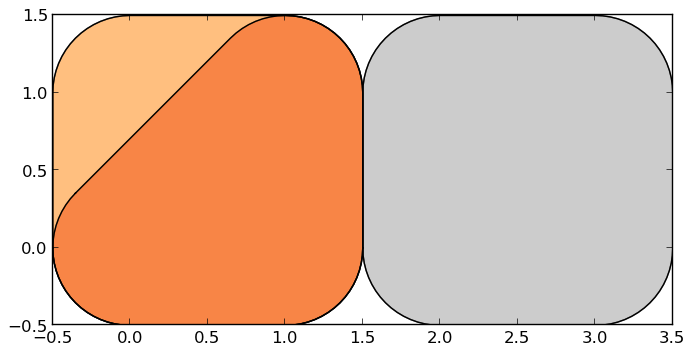
其他操作返回GeoPandas对象:
>>> g.buffer(0.5)
0    POLYGON ((-0.3535533905932737 0.35355339059327...
1    POLYGON ((-0.5 0, -0.5 1, -0.4975923633360985 ...
2    POLYGON ((1.5 0, 1.5 1, 1.502407636663901 1.04...
dtype: geometry
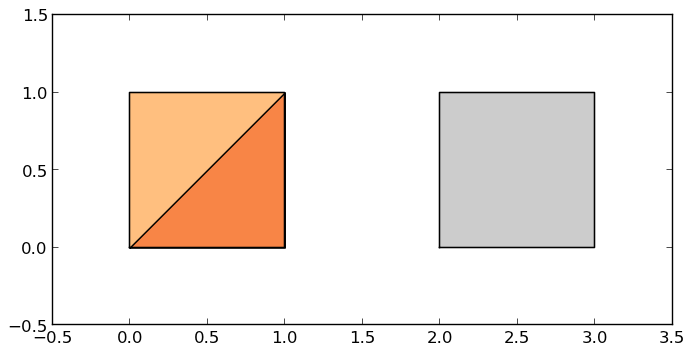
GeoPandas对象也知道如何绘制自己的曲线。GeoPandas使用 matplotlib 用来谋划。要生成我们的GeoSeries的绘图,请使用:
>>> g.plot()
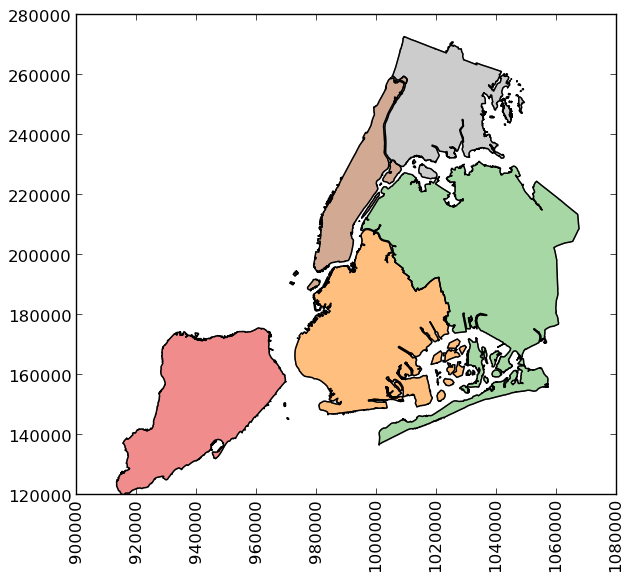
GeoPandas还实现了替代构造函数,该构造函数可以读取 fiona 。读取包含ESRI Shapefile的Zip文件 borough boundaries of New York City (GeoPandas将其作为示例数据集包括在内):
>>> nybb_path = geopandas.datasets.get_path('nybb')
>>> boros = geopandas.read_file(nybb_path)
>>> boros.set_index('BoroCode', inplace=True)
>>> boros.sort_index(inplace=True)
>>> boros
               BoroName     Shape_Leng    Shape_Area  \
BoroCode
1             Manhattan  359299.096471  6.364715e+08
2                 Bronx  464392.991824  1.186925e+09
3              Brooklyn  741080.523166  1.937479e+09
4                Queens  896344.047763  3.045213e+09
5         Staten Island  330470.010332  1.623820e+09

                                                   geometry
BoroCode
1         MULTIPOLYGON (((981219.0557861328 188655.31579...
2         MULTIPOLYGON (((1012821.805786133 229228.26458...
3         MULTIPOLYGON (((1021176.479003906 151374.79699...
4         MULTIPOLYGON (((1029606.076599121 156073.81420...
5         MULTIPOLYGON (((970217.0223999023 145643.33221...
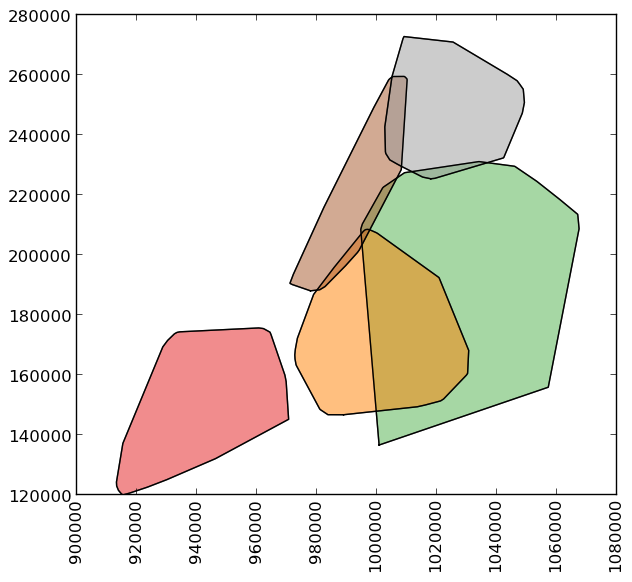
>>> boros['geometry'].convex_hull
BoroCode
1    POLYGON ((977855.4451904297 188082.3223876953,...
2    POLYGON ((1017949.977600098 225426.8845825195,...
3    POLYGON ((988872.8212280273 146772.0317993164,...
4    POLYGON ((1000721.531799316 136681.776184082, ...
5    POLYGON ((915517.6877458114 120121.8812543372,...
dtype: geometry
为了演示更复杂的操作,我们将生成一个 GeoSeries 包含2000个随机点:
>>> import numpy as np
>>> from shapely.geometry import Point
>>> xmin, xmax, ymin, ymax = 900000, 1080000, 120000, 280000
>>> xc = (xmax - xmin) * np.random.random(2000) + xmin
>>> yc = (ymax - ymin) * np.random.random(2000) + ymin
>>> pts = GeoSeries([Point(x, y) for x, y in zip(xc, yc)])
现在,在每个点周围画一个半径固定的圆:
>>> circles = pts.buffer(2000)
我们可以把这些圆圈压缩成一个单一的 MultiPolygon 具有的几何体
>>> mp = circles.unary_union
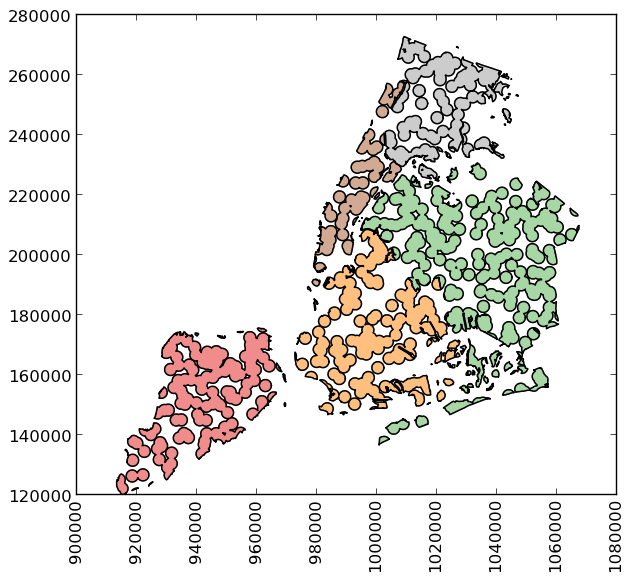
要提取包含在每个行政区中的几何图形部分,我们只需使用:
>>> holes = boros['geometry'].intersection(mp)
为了得到洞外的区域:
>>> boros_with_holes = boros['geometry'].difference(mp)
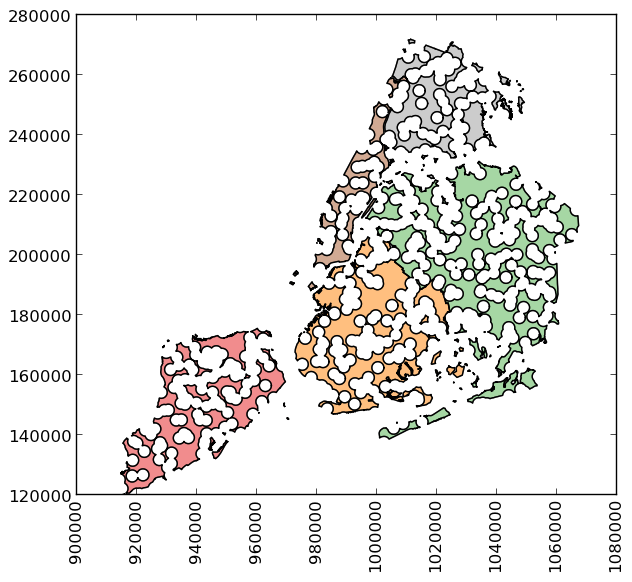
请注意,这可以稍微简化一些,因为 geometry 作为一个属性在 GeoDataFrame ,以及 intersection() 和 difference() 方法分别使用“&”和“-”运算符实现。例如,后者可以简单地表示为 boros.geometry - mp 。
很容易做一些事情,比如计算每个行政区在洞中的分数面积:
>>> holes.area / boros.geometry.area
BoroCode
1    0.579939
2    0.586833
3    0.608174
4    0.582172
5    0.558075
dtype: float64