scipy.interpolate.krogh_interpolate
- scipy.interpolate.krogh_interpolate(xi, yi, x, der=0, axis=0)[源代码]
多项式插值的方便函数。
看见
KroghInterpolator了解更多详细信息。- 参数
- xiarray_like
已知的x坐标。
- yiarray_like
形状的已知y坐标
(xi.size, R)。解释为长度为R的向量,如果R=1,则解释为标量。- xarray_like
评估导数的一个或多个点。
- derint或list,可选
要提取多少个导数;对于所有潜在的非零导数(即等于点数的数字)都不提取,或者要提取的派生列表。此数字包括作为0阶导数的函数值。
- axis整型,可选
与x坐标值对应的yi数组中的轴。
- 退货
- dndarray
如果内插器的值是R-D,则返回的数组将是N乘以R的导数数。如果 x 是标量,则中间维度将被删除;如果 yi 是标量,则最后一个维度将被删除。
参见
KroghInterpolator克罗插值器
注意事项
内插多项式的构造是一个相对昂贵的过程。如果您想重复计算它,可以考虑使用类KroghInterpolator(这就是这个函数使用的)。
示例
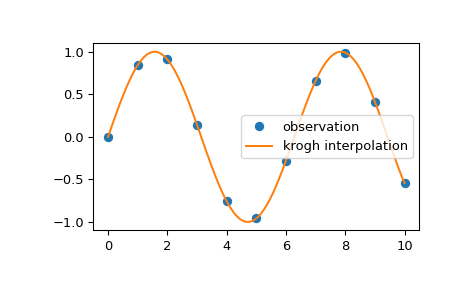
我们可以使用Krogh插值对2D观测数据进行插值:
>>> import matplotlib.pyplot as plt
>>> from scipy.interpolate import krogh_interpolate
>>> x_observed = np.linspace(0.0, 10.0, 11)
>>> y_observed = np.sin(x_observed)
>>> x = np.linspace(min(x_observed), max(x_observed), num=100)
>>> y = krogh_interpolate(x_observed, y_observed, x)
>>> plt.plot(x_observed, y_observed, "o", label="observation")
>>> plt.plot(x, y, label="krogh interpolation")
>>> plt.legend()
>>> plt.show()