scipy.interpolate.NearestNDInterpolator
- class scipy.interpolate.NearestNDInterpolator(x, y, rescale=False, tree_options=None)[源代码]
NearestNDInterpolator(x,y)。
N>1维的最近邻插值。
0.9 新版功能.
- 参数
- x(Npoint,Ndims)ndarray浮点数
数据点坐标。
- y浮点或复数的(Npoint,)ndarray
数据值。
- rescale布尔值,可选
在执行插值之前,重缩放指向单位立方体。如果某些输入尺寸具有不可公度的单位,并且相差许多量级,则此选项非常有用。
0.14.0 新版功能.
- tree_optionsDICT,可选
传递给基础
cKDTree。0.17.0 新版功能.
参见
griddata对非结构化的D-D数据进行插值。
LinearNDInterpolatorN维分段线性插值。
CloughTocher2DInterpolator分段三次,C1光滑,2D中曲率最小化插值。
注意事项
用途
scipy.spatial.cKDTree示例
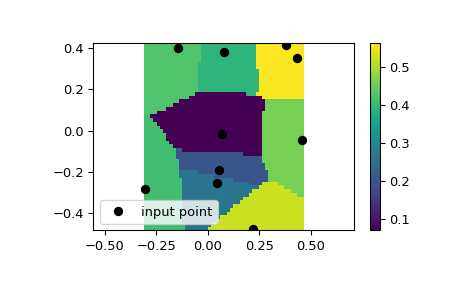
我们可以在2D平面上插入值:
>>> from scipy.interpolate import NearestNDInterpolator
>>> import matplotlib.pyplot as plt
>>> rng = np.random.default_rng()
>>> x = rng.random(10) - 0.5
>>> y = rng.random(10) - 0.5
>>> z = np.hypot(x, y)
>>> X = np.linspace(min(x), max(x))
>>> Y = np.linspace(min(y), max(y))
>>> X, Y = np.meshgrid(X, Y)  # 2D grid for interpolation
>>> interp = NearestNDInterpolator(list(zip(x, y)), z)
>>> Z = interp(X, Y)
>>> plt.pcolormesh(X, Y, Z, shading='auto')
>>> plt.plot(x, y, "ok", label="input point")
>>> plt.legend()
>>> plt.colorbar()
>>> plt.axis("equal")
>>> plt.show()
方法:
__call__\(*参数)在给定点评估插值器。