备注
互动在线版: 
使用Folium打印#
什么是Folium?
Folium 构建于Python生态系统的数据争论优势和leavlet.js库的映射优势之上。这允许您在Geopandas中操作您的数据,并通过Folium将其可视化到传单地图上。
在本例中,我们将首先使用Geopandas加载几何图形(火山点数据),然后创建带有代表不同类型火山的标记的Folium地图。
加载几何图形#
此示例使用免费提供的 volcano dataset 。我们将使用熊猫读取CSV文件,然后将熊猫 DataFrame 对一只地质熊猫来说 GeoDataFrame 。
[1]:
# Import Libraries
import pandas as pd
import geopandas
import folium
import matplotlib.pyplot as plt
[2]:
df1 = pd.read_csv('volcano_data_2010.csv')

# Keep only relevant columns
df = df1.loc[:, ("Year", "Name", "Country", "Latitude", "Longitude", "Type")]
df.info()
<class 'pandas.core.frame.DataFrame'>
RangeIndex: 63 entries, 0 to 62
Data columns (total 6 columns):
 #   Column     Non-Null Count  Dtype
---  ------     --------------  -----
 0   Year       63 non-null     int64
 1   Name       63 non-null     object
 2   Country    63 non-null     object
 3   Latitude   63 non-null     float64
 4   Longitude  63 non-null     float64
 5   Type       63 non-null     object
dtypes: float64(2), int64(1), object(3)
memory usage: 3.1+ KB
[3]:
# Create point geometries
geometry = geopandas.points_from_xy(df.Longitude, df.Latitude)
geo_df = geopandas.GeoDataFrame(df[['Year','Name','Country', 'Latitude', 'Longitude', 'Type']], geometry=geometry)

geo_df.head()
[3]:
| Year | Name | Country | Latitude | Longitude | Type | geometry | |
|---|---|---|---|---|---|---|---|
| 0 | 2010 | Tungurahua | Ecuador | -1.467 | -78.442 | Stratovolcano | POINT (-78.44200 -1.46700) |
| 1 | 2010 | Eyjafjallajokull | Iceland | 63.630 | -19.620 | Stratovolcano | POINT (-19.62000 63.63000) |
| 2 | 2010 | Pacaya | Guatemala | 14.381 | -90.601 | Complex volcano | POINT (-90.60100 14.38100) |
| 3 | 2010 | Sarigan | United States | 16.708 | 145.780 | Stratovolcano | POINT (145.78000 16.70800) |
| 4 | 2010 | Karangetang [Api Siau] | Indonesia | 2.780 | 125.480 | Stratovolcano | POINT (125.48000 2.78000) |
[4]:
world = geopandas.read_file(geopandas.datasets.get_path('naturalearth_lowres'))
df.Type.unique()
[4]:
array(['Stratovolcano', 'Complex volcano', 'Shield volcano',
       'Subglacial volcano', 'Lava dome', 'Caldera'], dtype=object)
[5]:
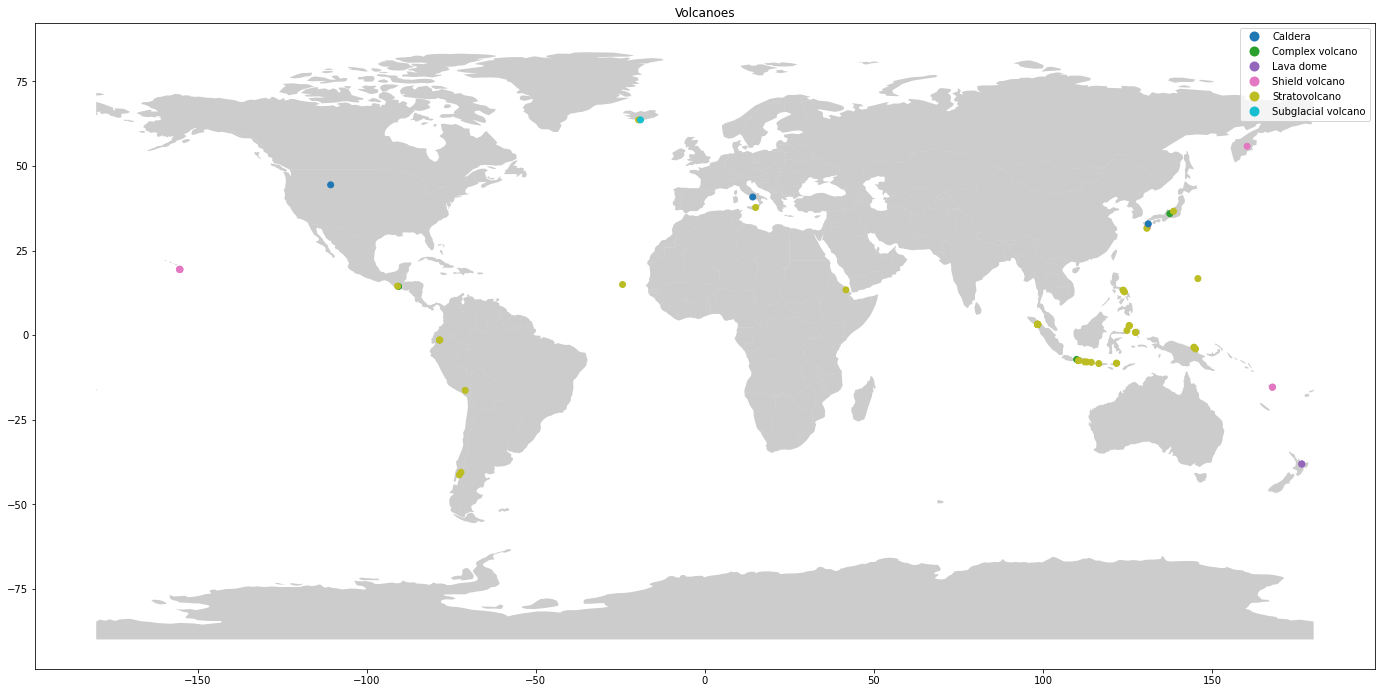
fig, ax = plt.subplots(figsize=(24,18))
world.plot(ax=ax, alpha=0.4, color='grey')
geo_df.plot(column='Type', ax=ax, legend=True)
plt.title('Volcanoes')
[5]:
Text(0.5, 1.0, 'Volcanoes')
创建Folium贴图#
Folium有许多来自OpenStreetMap、Mapbox和Stamen的内置切片集。例如:
[6]:
# Stamen Terrain
map = folium.Map(location = [13.406,80.110], tiles = "Stamen Terrain", zoom_start = 9)
map
[6]:
Make this Notebook Trusted to load map: File -> Trust Notebook
[7]:
# OpenStreetMap
map = folium.Map(location = [13.406,80.110], tiles='OpenStreetMap' , zoom_start = 9)
map
[7]:
Make this Notebook Trusted to load map: File -> Trust Notebook
[8]:
# Stamen Toner
map = folium.Map(location = [13.406,80.110], tiles='Stamen Toner', zoom_start = 9)
map
[8]:
Make this Notebook Trusted to load map: File -> Trust Notebook
本示例使用斯塔门地形地图层来可视化火山地形。
[9]:
# Use terrain map layer to see volcano terrain
map = folium.Map(location = [4,10], tiles = "Stamen Terrain", zoom_start = 3)
添加标记#
要表示不同类型的火山,您可以创建Folium标记并将其添加到地图中。
[10]:
# Create a geometry list from the GeoDataFrame
geo_df_list = [[point.xy[1][0], point.xy[0][0]] for point in geo_df.geometry ]

# Iterate through list and add a marker for each volcano, color-coded by its type.
i = 0
for coordinates in geo_df_list:
    #assign a color marker for the type of volcano, Strato being the most common
    if geo_df.Type[i] == "Stratovolcano":
        type_color = "green"
    elif geo_df.Type[i] == "Complex volcano":
        type_color = "blue"
    elif geo_df.Type[i] == "Shield volcano":
        type_color = "orange"
    elif geo_df.Type[i] == "Lava dome":
        type_color = "pink"
    else:
        type_color = "purple"


    # Place the markers with the popup labels and data
    map.add_child(folium.Marker(location = coordinates,
                            popup =
                            "Year: " + str(geo_df.Year[i]) + '<br>' +
                            "Name: " + str(geo_df.Name[i]) + '<br>' +
                            "Country: " + str(geo_df.Country[i]) + '<br>'
                            "Type: " + str(geo_df.Type[i]) + '<br>'
                            "Coordinates: " + str(geo_df_list[i]),
                            icon = folium.Icon(color = "%s" % type_color)))
    i = i + 1
[11]:
map
[11]:
Make this Notebook Trusted to load map: File -> Trust Notebook
叶热图#
Folium以其热图而闻名,它创建了一个热图层。要在Folium中绘制热图,您需要一个纬度和经度列表。
[12]:
# This example uses heatmaps to visualize the density of volcanoes
# which is more in some parts of the world compared to others.

from folium import plugins

map = folium.Map(location = [15,30], tiles='Cartodb dark_matter', zoom_start = 2)

heat_data = [[point.xy[1][0], point.xy[0][0]] for point in geo_df.geometry ]

heat_data
plugins.HeatMap(heat_data).add_to(map)

map
[12]:
Make this Notebook Trusted to load map: File -> Trust Notebook