备注
此页面是从 `gallery/matplotlib_scalebar.ipynb`_ _.
互动在线版: 
向matplotlib绘图添加比例尺#
在matplotlib中制作地理空间图时,可以使用 maplotlib-scalebar library 若要添加比例尺,请执行以下操作。
[1]:
import geopandas as gpd
from matplotlib_scalebar.scalebar import ScaleBar
---------------------------------------------------------------------------
ModuleNotFoundError                       Traceback (most recent call last)
Input In [1], in <cell line: 2>()
      1 import geopandas as gpd
----> 2 from matplotlib_scalebar.scalebar import ScaleBar

ModuleNotFoundError: No module named 'matplotlib_scalebar'
创建ScaleBar对象#
创建ScaleBar对象所需的唯一参数是 dx 。这等于现实世界中一个像素的大小。此参数的值取决于您的CRS的单位。
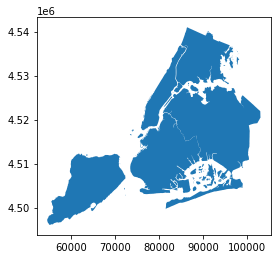
投影坐标系(米)#
添加比例尺的最简单方法是使用以米为单位的投影坐标系。就这么定了 dx = 1 :
[2]:
nybb = gpd.read_file(gpd.datasets.get_path('nybb'))
nybb = nybb.to_crs(32619)  # Convert the dataset to a coordinate
# system which uses meters

ax = nybb.plot()
ax.add_artist(ScaleBar(1))
---------------------------------------------------------------------------
NameError                                 Traceback (most recent call last)
Input In [2], in <cell line: 6>()
      3 # system which uses meters
      5 ax = nybb.plot()
----> 6 ax.add_artist(ScaleBar(1))

NameError: name 'ScaleBar' is not defined
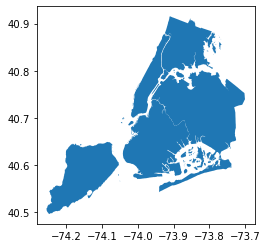
地理坐标系(度)#
以度为单位的地理坐标系,
dx should be equal to a distance in meters of two points with the same latitude (Y coordinate) which are one full degree of longitude (X) apart. You can calculate this distance by online calculator (e.g. the Great Circle calculator) 或者在地貌大熊猫。首先,我们将创建一个包含两个点的GeoSeries,这两个点的坐标大致与NYC相同。它们位于同一纬度,但彼此的经度相差一度。它们的初始坐标在地理坐标系(地理WGS 84)中指定。然后将它们转换为投影系统进行计算:
[3]:
from shapely.geometry.point import Point

points = gpd.GeoSeries([Point(-73.5, 40.5), Point(-74.5, 40.5)], crs=4326)  # Geographic WGS 84 - degrees
points = points.to_crs(32619) # Projected WGS 84 - meters
转换后,我们可以计算点之间的距离。结果与大圆计算器略有不同,但差异不大(84,921米和84,767米):
[4]:
distance_meters = points[0].distance(points[1])
最后,我们能够在我们的地块中使用地理坐标系。我们设定的值 dx 参数设置为我们刚刚计算的距离:
[5]:
nybb = gpd.read_file(gpd.datasets.get_path('nybb'))
nybb = nybb.to_crs(4326)  # Using geographic WGS 84

ax = nybb.plot()
ax.add_artist(ScaleBar(distance_meters))
---------------------------------------------------------------------------
NameError                                 Traceback (most recent call last)
Input In [5], in <cell line: 5>()
      2 nybb = nybb.to_crs(4326)  # Using geographic WGS 84
      4 ax = nybb.plot()
----> 5 ax.add_artist(ScaleBar(distance_meters))

NameError: name 'ScaleBar' is not defined
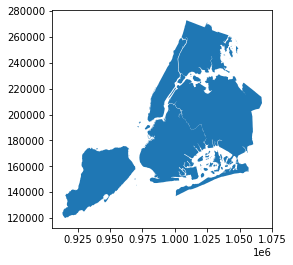
使用其他单位#
的默认单位 dx 是m(米)。可以通过以下方式更改此单位 units 和 dimension 参数。这里有一份可能的清单 units 对于不同的值 dimension 以下是:
尺寸标注 |
单位 |
|---|---|
硅长度 |
公里、米、厘米、嗯 |
英制长度 |
In、ft、yd、mi |
SI长度-倒数 |
1/米、1/厘米 |
角度 |
度 |
在下面的示例中,我们将数据集保留在以英尺为单位的初始CRS中。该图显示了2法里(约11公里)的比例尺:
[6]:
nybb = gpd.read_file(gpd.datasets.get_path('nybb'))

ax = nybb.plot()
ax.add_artist(ScaleBar(1, dimension="imperial-length", units="ft"))
---------------------------------------------------------------------------
NameError                                 Traceback (most recent call last)
Input In [6], in <cell line: 4>()
      1 nybb = gpd.read_file(gpd.datasets.get_path('nybb'))
      3 ax = nybb.plot()
----> 4 ax.add_artist(ScaleBar(1, dimension="imperial-length", units="ft"))

NameError: name 'ScaleBar' is not defined
比例尺的定制#
[7]:
nybb = gpd.read_file(gpd.datasets.get_path('nybb')).to_crs(32619)
ax = nybb.plot()

# Position and layout
scale1 = ScaleBar(
dx=1, label='Scale 1',
    location='upper left',  # in relation to the whole plot
    label_loc='left', scale_loc='bottom'  # in relation to the line
)

# Color
scale2 = ScaleBar(
    dx=1, label='Scale 2', location='center',
    color='#b32400', box_color='yellow',
    box_alpha=0.8  # Slightly transparent box
)

# Font and text formatting
scale3 = ScaleBar(
    dx=1, label='Scale 3',
    font_properties={'family':'serif', 'size': 'large'},  # For more information, see the cell below
    scale_formatter=lambda value, unit: f'> {value} {unit} <'
)

ax.add_artist(scale1)
ax.add_artist(scale2)
ax.add_artist(scale3)
---------------------------------------------------------------------------
NameError                                 Traceback (most recent call last)
Input In [7], in <cell line: 5>()
      2 ax = nybb.plot()
      4 # Position and layout
----> 5 scale1 = ScaleBar(
      6 dx=1, label='Scale 1',
      7     location='upper left',  # in relation to the whole plot
      8     label_loc='left', scale_loc='bottom'  # in relation to the line
      9 )
     11 # Color
     12 scale2 = ScaleBar(
     13     dx=1, label='Scale 2', location='center',
     14     color='#b32400', box_color='yellow',
     15     box_alpha=0.8  # Slightly transparent box
     16 )

NameError: name 'ScaleBar' is not defined
