备注
此页面是从 `gallery/cartopy_convert.ipynb`_ _.
互动在线版: 
用CartoPy和GeoPandas绘图#
在GeoPandas和CartoPy之间转换以可视化数据。
CartoPy 是一个专门创建地理空间可视化的Python库。它表示坐标参考系(CRS)以及构建地块的方式略有不同。此示例逐步介绍了GeoPandas和CartoPy之间的数据往返传输。
首先,我们将使用GeoPandas加载数据。
[1]:
import matplotlib.pyplot as plt
import geopandas
from cartopy import crs as ccrs

path = geopandas.datasets.get_path('naturalearth_lowres')
df = geopandas.read_file(path)
# Add a column we'll use later
df['gdp_pp'] = df['gdp_md_est'] / df['pop_est']
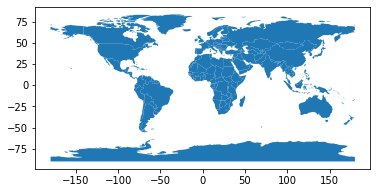
首先,我们将使用GeoPandas可视化地图
[2]:
df.plot()
[2]:
<AxesSubplot:>
使用CartoPy打印#
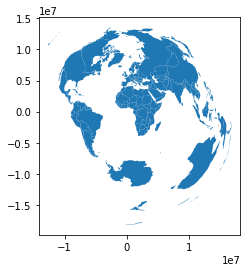
Cartopy也很好地处理形状对象,但它对CRS使用了不同的系统。要使用CartoPy绘制这些数据,我们首先需要将其投影到新的CRS中。我们将使用CartoPy中定义的CRS和GeoPandas to_crs 方法进行转换。
[3]:
# Define the CartoPy CRS object.
crs = ccrs.AzimuthalEquidistant()
# This can be converted into a `proj4` string/dict compatible with GeoPandas
crs_proj4 = crs.proj4_init
df_ae = df.to_crs(crs_proj4)
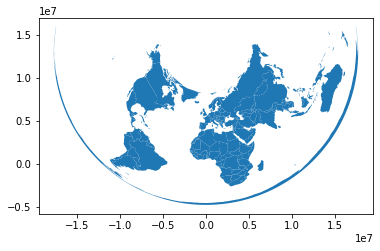
# Here's what the plot looks like in GeoPandas
df_ae.plot()
[3]:
<AxesSubplot:>
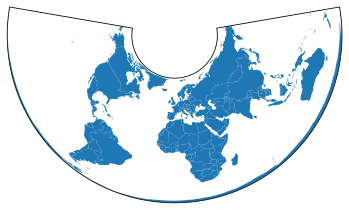
现在我们的数据在基于CartoPy的CRS中,我们可以很容易地绘制它。
[4]:
fig, ax = plt.subplots(subplot_kw={'projection': crs})
ax.add_geometries(df_ae['geometry'], crs=crs)
[4]:
<cartopy.mpl.feature_artist.FeatureArtist at 0x7fd708b1fca0>

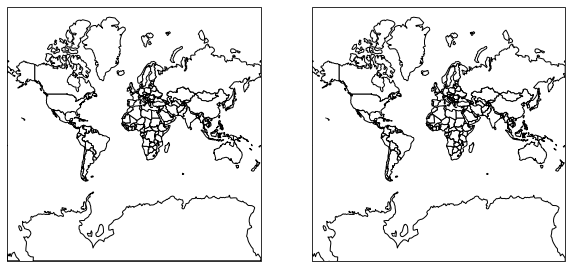
请注意,我们可以使用如下所示的EPSG代码轻松完成此操作:
[5]:
crs_epsg = ccrs.epsg('3857')
df_epsg = df.to_crs(epsg='3857')

# Generate a figure with two axes, one for CartoPy, one for GeoPandas
fig, axs = plt.subplots(1, 2, subplot_kw={'projection': crs_epsg},
                        figsize=(10, 5))
# Make the CartoPy plot
axs[0].add_geometries(df_epsg['geometry'], crs=crs_epsg,
                      facecolor='white', edgecolor='black')
# Make the GeoPandas plot
df_epsg.plot(ax=axs[1], color='white', edgecolor='black')
[5]:
<GeoAxesSubplot:>
CartoPy to GeoPandas#
接下来,我们将在CartoPy中执行CRS投影,然后将其转换回GeoPandas对象。
[6]:
crs_new = ccrs.AlbersEqualArea()
new_geometries = [crs_new.project_geometry(ii, src_crs=crs)
                  for ii in df_ae['geometry'].values]

fig, ax = plt.subplots(subplot_kw={'projection': crs_new})
ax.add_geometries(new_geometries, crs=crs_new)
[6]:
<cartopy.mpl.feature_artist.FeatureArtist at 0x7fd708adcb50>
现在我们已经使用CartoPy CRS创建了新的Shaply对象,我们可以使用它来创建一个GeoDataFrame。
[7]:
df_aea = geopandas.GeoDataFrame(df['gdp_pp'], geometry=new_geometries,
                                crs=crs_new.proj4_init)
df_aea.plot()
[7]:
<AxesSubplot:>
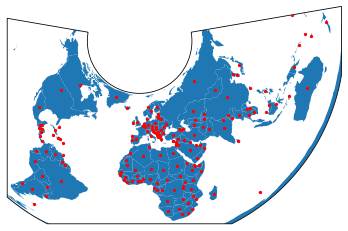
我们甚至可以将这些组合成相同的数字。在这里,我们将使用CartoPy绘制国家的形状。然后,我们将计算每个GeoPandas的质心,并将其绘制在顶部。
[8]:
# Generate a CartoPy figure and add the countries to it
fig, ax = plt.subplots(subplot_kw={'projection': crs_new})
ax.add_geometries(new_geometries, crs=crs_new)

# Calculate centroids and plot
df_aea_centroids = df_aea.geometry.centroid
# Need to provide "zorder" to ensure the points are plotted above the polygons
df_aea_centroids.plot(ax=ax, markersize=5, color='r', zorder=10)

plt.show()