备注
互动在线版: 
使用坐标从DataFrame创建GeoDataFrame#
此示例说明如何创建 GeoDataFrame when starting from a regular DataFrame that has coordinates either WKT (well-known text )格式,或在两栏中。
[1]:
import pandas as pd
import geopandas
import matplotlib.pyplot as plt
从经度和纬度#
首先,让我们考虑一个 DataFrame 包含城市及其各自的经度和纬度。
[2]:
df = pd.DataFrame(
    {'City': ['Buenos Aires', 'Brasilia', 'Santiago', 'Bogota', 'Caracas'],
     'Country': ['Argentina', 'Brazil', 'Chile', 'Colombia', 'Venezuela'],
     'Latitude': [-34.58, -15.78, -33.45, 4.60, 10.48],
     'Longitude': [-58.66, -47.91, -70.66, -74.08, -66.86]})
A GeoDataFrame 需要一个 shapely 对象。我们使用的是地理熊猫 points_from_xy() 转型 经度 和 纬度 添加到一个列表中 shapely.Point 对象,并将其设置为 geometry 在创建 GeoDataFrame 。(请注意 points_from_xy() 是一个增强的包装器,用于 [Point(x, y) for x, y in zip(df.Longitude, df.Latitude)] )
[3]:
gdf = geopandas.GeoDataFrame(
    df, geometry=geopandas.points_from_xy(df.Longitude, df.Latitude))
gdf 如下所示:
[4]:
print(gdf.head())
           City    Country  Latitude  Longitude                     geometry
0  Buenos Aires  Argentina    -34.58     -58.66  POINT (-58.66000 -34.58000)
1      Brasilia     Brazil    -15.78     -47.91  POINT (-47.91000 -15.78000)
2      Santiago      Chile    -33.45     -70.66  POINT (-70.66000 -33.45000)
3        Bogota   Colombia      4.60     -74.08    POINT (-74.08000 4.60000)
4       Caracas  Venezuela     10.48     -66.86   POINT (-66.86000 10.48000)
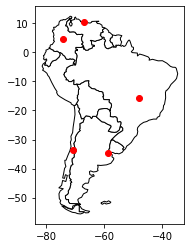
最后,我们在国家/地区地图上绘制坐标。
[5]:
world = geopandas.read_file(geopandas.datasets.get_path('naturalearth_lowres'))

# We restrict to South America.
ax = world[world.continent == 'South America'].plot(
    color='white', edgecolor='black')

# We can now plot our ``GeoDataFrame``.
gdf.plot(ax=ax, color='red')

plt.show()

从WKT格式#
在这里,我们考虑一个 DataFrame 具有WKT格式的坐标。
[6]:
df = pd.DataFrame(
    {'City': ['Buenos Aires', 'Brasilia', 'Santiago', 'Bogota', 'Caracas'],
     'Country': ['Argentina', 'Brazil', 'Chile', 'Colombia', 'Venezuela'],
     'Coordinates': ['POINT(-58.66 -34.58)', 'POINT(-47.91 -15.78)',
                     'POINT(-70.66 -33.45)', 'POINT(-74.08 4.60)',
                     'POINT(-66.86 10.48)']})
我们使用 shapely.wkt 解析WKT格式的子模块:
[7]:
from shapely import wkt

df['Coordinates'] = geopandas.GeoSeries.from_wkt(df['Coordinates'])
这个 GeoDataFrame 按如下方式构建:
[8]:
gdf = geopandas.GeoDataFrame(df, geometry='Coordinates')

print(gdf.head())
           City    Country                  Coordinates
0  Buenos Aires  Argentina  POINT (-58.66000 -34.58000)
1      Brasilia     Brazil  POINT (-47.91000 -15.78000)
2      Santiago      Chile  POINT (-70.66000 -33.45000)
3        Bogota   Colombia    POINT (-74.08000 4.60000)
4       Caracas  Venezuela   POINT (-66.86000 10.48000)
再说一次,我们可以把我们的 GeoDataFrame 。
[9]:
ax = world[world.continent == 'South America'].plot(
    color='white', edgecolor='black')

gdf.plot(ax=ax, color='red')

plt.show()