备注
将背景地图添加到绘图#
此示例显示了如何将背景底图添加到使用地理公园创建的地块 .plot() method. This makes use of the contextily 用于从多个来源(OpenStreetMap、Stamen)检索Web地图切片的包。还可以查看上下文中的 introduction guide 有关此处未介绍的可能的新功能。
[1]:
import geopandas
import contextily as cx
---------------------------------------------------------------------------
ModuleNotFoundError                       Traceback (most recent call last)
Input In [1], in <cell line: 2>()
      1 import geopandas
----> 2 import contextily as cx

ModuleNotFoundError: No module named 'contextily'
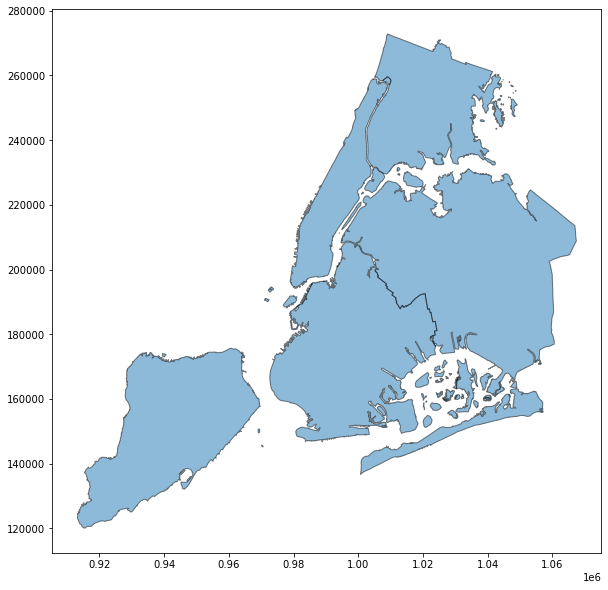
让我们使用geopandas数据集中可用的纽约市行政区边界数据。绘制此图将产生以下结果:
[2]:
df = geopandas.read_file(geopandas.datasets.get_path('nybb'))
ax = df.plot(figsize=(10, 10), alpha=0.5, edgecolor='k')

匹配坐标系#
Before adding web map tiles to this plot, we first need to ensure the coordinate reference systems (CRS) of the tiles and the data match. Web map tiles are typically provided in Web Mercator (EPSG 3857), so let us first check what CRS our NYC boroughs are in:
[3]:
df.crs
[3]:
<Derived Projected CRS: EPSG:2263>
Name: NAD83 / New York Long Island (ftUS)
Axis Info [cartesian]:
- X[east]: Easting (US survey foot)
- Y[north]: Northing (US survey foot)
Area of Use:
- name: United States (USA) - New York - counties of Bronx; Kings; Nassau; New York; Queens; Richmond; Suffolk.
- bounds: (-74.26, 40.47, -71.8, 41.3)
Coordinate Operation:
- name: SPCS83 New York Long Island zone (US Survey feet)
- method: Lambert Conic Conformal (2SP)
Datum: North American Datum 1983
- Ellipsoid: GRS 1980
- Prime Meridian: Greenwich
现在我们知道CRS不匹配,所以我们需要选择我们希望在哪个CRS中可视化数据:要么是块的CRS,要么是数据的CRS,甚至是另一个CRS。
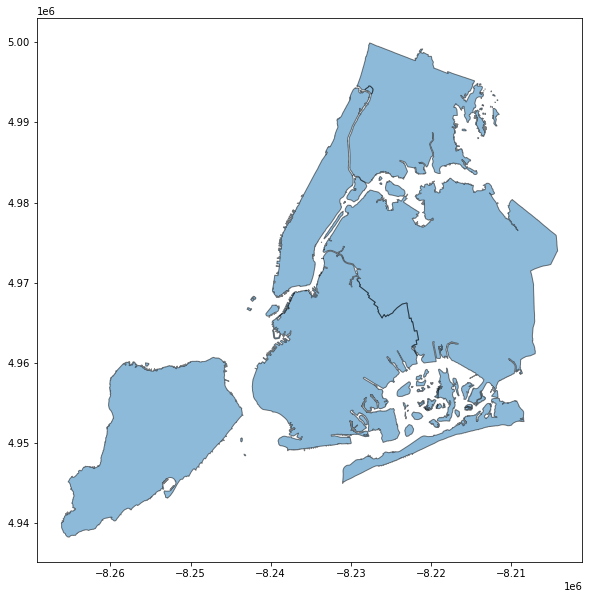
匹配CRS的第一个选项是利用 to_crs GeoDataFrames方法将数据的CRS转换为Web墨卡托:
[4]:
df_wm = df.to_crs(epsg=3857)
然后我们就可以使用 add_basemap 上下文功能,可以轻松地将背景地图添加到我们的绘图中:
[5]:
ax = df_wm.plot(figsize=(10, 10), alpha=0.5, edgecolor='k')
cx.add_basemap(ax)
---------------------------------------------------------------------------
NameError                                 Traceback (most recent call last)
Input In [5], in <cell line: 2>()
      1 ax = df_wm.plot(figsize=(10, 10), alpha=0.5, edgecolor='k')
----> 2 cx.add_basemap(ax)

NameError: name 'cx' is not defined

如果我们想要转换切片的CRS,这对于大型数据集可能是可取的,我们可以使用 crs 的关键字参数 add_basemap 具体如下:
[6]:
ax = df.plot(figsize=(10, 10), alpha=0.5, edgecolor='k')
cx.add_basemap(ax, crs=df.crs)
---------------------------------------------------------------------------
NameError                                 Traceback (most recent call last)
Input In [6], in <cell line: 2>()
      1 ax = df.plot(figsize=(10, 10), alpha=0.5, edgecolor='k')
----> 2 cx.add_basemap(ax, crs=df.crs)

NameError: name 'cx' is not defined
这会将贴图平铺重新投影到目标CRS,这在某些情况下可能会导致锐度损失。看见 contextily’s guide on warping tiles 获取有关该主题的更多信息。
控制细节级别#
我们可以使用可选的控制地图切片的详细信息 zoom 关键字(注意不要指定过高 zoom 级别,因为这可能会导致大量下载)。
[7]:
ax = df_wm.plot(figsize=(10, 10), alpha=0.5, edgecolor='k')
cx.add_basemap(ax, zoom=12)
---------------------------------------------------------------------------
NameError                                 Traceback (most recent call last)
Input In [7], in <cell line: 2>()
      1 ax = df_wm.plot(figsize=(10, 10), alpha=0.5, edgecolor='k')
----> 2 cx.add_basemap(ax, zoom=12)

NameError: name 'cx' is not defined

选择不同的风格#
默认情况下,上下文使用斯塔门地形样式。我们可以使用指定不同的样式 cx.providers :
[8]:
ax = df_wm.plot(figsize=(10, 10), alpha=0.5, edgecolor='k')
cx.add_basemap(ax, source=cx.providers.Stamen.TonerLite)
ax.set_axis_off()
---------------------------------------------------------------------------
NameError                                 Traceback (most recent call last)
Input In [8], in <cell line: 2>()
      1 ax = df_wm.plot(figsize=(10, 10), alpha=0.5, edgecolor='k')
----> 2 cx.add_basemap(ax, source=cx.providers.Stamen.TonerLite)
      3 ax.set_axis_off()

NameError: name 'cx' is not defined
将标注添加为叠加#
有时,在底图上打印数据时,数据会遮挡一些重要的地图元素,例如标签,否则这些元素将不会被遮挡。一些地图切片提供商提供多组部分透明的切片来解决此问题,并且 contextily 将尽最大努力自动检测这些透明层,并将它们放在顶部。
[9]:
ax = df_wm.plot(figsize=(10, 10), alpha=0.5, edgecolor='k')
cx.add_basemap(ax, source=cx.providers.Stamen.TonerLite)
cx.add_basemap(ax, source=cx.providers.Stamen.TonerLabels)
---------------------------------------------------------------------------
NameError                                 Traceback (most recent call last)
Input In [9], in <cell line: 2>()
      1 ax = df_wm.plot(figsize=(10, 10), alpha=0.5, edgecolor='k')
----> 2 cx.add_basemap(ax, source=cx.providers.Stamen.TonerLite)
      3 cx.add_basemap(ax, source=cx.providers.Stamen.TonerLabels)

NameError: name 'cx' is not defined

通过像这样拆分各个层,您还可以独立地操作每个层上的缩放级别,例如,在显示大量细节的同时使标签更大。
[10]:
ax = df_wm.plot(figsize=(10, 10), alpha=0.5, edgecolor='k')
cx.add_basemap(ax, source=cx.providers.Stamen.Watercolor, zoom=12)
cx.add_basemap(ax, source=cx.providers.Stamen.TonerLabels, zoom=10)
---------------------------------------------------------------------------
NameError                                 Traceback (most recent call last)
Input In [10], in <cell line: 2>()
      1 ax = df_wm.plot(figsize=(10, 10), alpha=0.5, edgecolor='k')
----> 2 cx.add_basemap(ax, source=cx.providers.Stamen.Watercolor, zoom=12)
      3 cx.add_basemap(ax, source=cx.providers.Stamen.TonerLabels, zoom=10)

NameError: name 'cx' is not defined
