普洛普卡
Tool for generating a principal component analysis (PCA) plot from multiBamSummary or multiBigwigSummary output. By default, the loadings for each sample in each principal component is plotted. If the data is transposed, the projections of each sample on the requested principal components is plotted instead.
Detailed help:
plotPCA -h
usage: plotPCA -in coverage.npz -o pca.png
help: plotPCA -h / plotPCA --help
Named Arguments
- --transpose
Perform the PCA on the transposed matrix, (i.e., on the matrix where rows are samples and columns are bins/features. This then matches what is typically done in R.
- --rowCenter
When specified, each row (bin, gene, etc.) in the matrix is centered at 0 before the PCA is computed. This is useful only if you have a strong bin/gene/etc. correlation and the resulting principal component has samples stacked vertically. This option is not applicable if --transpose is specified.
Required arguments
- --corData, -in
Coverage file (generated by multiBamSummary or multiBigwigSummary)
Optional arguments
- --plotFile, -o
File name to save the plot to. The extension determines the file format. For example: pca.pdf will save the PCA plot in PDF format. The available options are: .png, .eps, .pdf and .svg. If this option is omitted, then you MUST specify --outFileNameData
- --labels, -l
User defined labels instead of default labels from file names. Multiple labels have to be separated by spaces, e.g. --labels sample1 sample2 sample3
- --plotTitle, -T
Title of the plot, to be printed on top of the generated image. Leave blank for no title. (Default: )
- --plotFileFormat
Possible choices: png, pdf, svg, eps, plotly
Image format type. If given, this option overrides the image format based on the plotFile ending. The available options are: png, eps, pdf, plotly and svg.
- --plotHeight
Plot height in cm. (Default: 10)
- --plotWidth
Plot width in cm. The minimum value is 1 cm. (Default: 10)
- --outFileNameData
File name to which the data underlying the plot should be saved, such as myPCA.tab. For untransposed data, this is the loading per-sample and PC as well as the eigenvalues. For transposed data, this is the rotation per-sample and PC and the eigenvalues. The projections are truncated to the number of eigenvalues for transposed data.
- --ntop
Use only the top N most variable rows in the original matrix. Specifying 0 will result in all rows being used. If the matrix is to be transposed, rows with 0 variance are always excluded, even if a values of 0 is specified. The default is 1000. (Default: 1000)
- --PCs
The principal components to plot. If specified, you must provide two different integers, greater than zero, separated by a space. An example (and the default) is "1 2". (Default: [1, 2])
- --log2
log2 transform the datapoints prior to computing the PCA. Note that 0.01 is added to all values to prevent 0 values from becoming -infinity. Using this option with input that contains negative values will result in an error.
- --colors
A list of colors for the symbols. Color names and html hex string (e.g., #eeff22) are accepted. The color names should be space separated. For example, --colors red blue green. If not specified, the symbols will be given automatic colors.
- --markers
A list of markers for the symbols. (e.g., '<','>','o') are accepted. The marker values should be space separated. For example, --markers 's' 'o' 's' 'o'. If not specified, the symbols will be given automatic shapes.
- --version
show program's version number and exit
example usages: plotPCA -in coverages.npz -o pca.png
背景
例如,主成分分析(PCA)可用于确定 样本显示出更大的可变性 在实验条件之间比在相同的重复治疗之间。PCA还可用于识别意外的模式,如由批处理效果或异常值引起的模式。主成分代表数据变化最大的方向,因此来自数千个区域的信息(例如,读取覆盖值)可以用几个维度表示。
备注
PCA并不是用来识别未知的分组或聚类,并且给出一个意想不到的结果,而是由研究人员来确定主要成分背后的实验或技术原因。
使用实例
plotPCA needs the compressed numpy array output from either 多BAM摘要 or 多大人物概要
$ deepTools2.0/bin/plotPCA -in readCounts.npz \
-o PCA_readCounts.png \
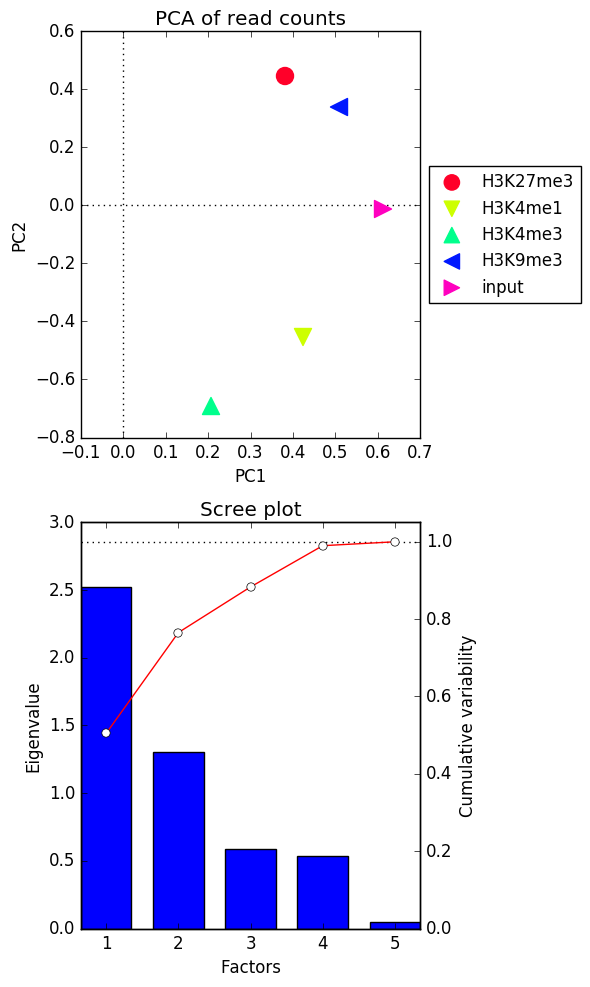
-T "PCA of read counts"
在对作为输入提供的值执行PCA后, plotPCA 将根据其解释的数据的可变性量对主要成分进行排序。基于此,您将获得两个图:
的特征值 前两个主要组成部分
这个 碎石图 对于前五个主要组成部分,其中条形代表由单个因素解释的变化量,红线则表示由单个组成部分以累积方式解释的变化量。
deepTools Galaxy <http://deeptools.ie-freiburg.mpg.de> _. |
code @ github <https://github.com/deeptools/deepTools/> _. |