地图
This tool creates a heatmap for scores associated with genomic regions. The program requires a matrix file generated by the tool computeMatrix.
usage: plotHeatmap -m matrix.gz
help: plotHeatmap -h / plotHeatmap --help
Required arguments
- --matrixFile, -m
Matrix file from the computeMatrix tool.
- --outFileName, -out, -o
File name to save the image to. The file ending will be used to determine the image format. The available options are: "png", "eps", "pdf" and "svg", e.g., MyHeatmap.png.
Output options
- --outFileSortedRegions
File name into which the regions are saved after skipping zeros or min/max threshold values. The order of the regions in the file follows the sorting order selected. This is useful, for example, to generate other heatmaps while keeping the sorting of the first heatmap. Example: Heatmap1sortedRegions.bed
- --outFileNameMatrix
If this option is given, then the matrix of values underlying the heatmap will be saved using this name, e.g. MyMatrix.gz.
- --interpolationMethod
Possible choices: auto, nearest, bilinear, bicubic, gaussian
If the heatmap image contains a large number of columns is usually better to use an interpolation method to produce better results (see https://matplotlib.org/examples/images_contours_and_fields/interpolation_methods.html). Be default, plotHeatmap uses the method nearest if the number of columns is 1000 or less. Otherwise it uses the bilinear method. This default behaviour can be changed by using any of the following options: "nearest", "bilinear", "bicubic", "gaussian"
- --dpi
Set the DPI to save the figure.
Clustering arguments
- --kmeans
Number of clusters to compute. When this option is set, the matrix is split into clusters using the k-means algorithm. Only works for data that is not grouped, otherwise only the first group will be clustered. If more specific clustering methods are required, then save the underlying matrix and run the clustering using other software. The plotting of the clustering may fail with an error if a cluster has very few members compared to the total number or regions.
- --hclust
Number of clusters to compute. When this option is set, then the matrix is split into clusters using the hierarchical clustering algorithm, using "ward linkage". Only works for data that is not grouped, otherwise only the first group will be clustered. --hclust could be very slow if you have >1000 regions. In those cases, you might prefer --kmeans or if more clustering methods are required you can save the underlying matrix and run the clustering using other software. The plotting of the clustering may fail with an error if a cluster has very few members compared to the total number of regions.
- --silhouette
Compute the silhouette score for regions. This is only applicable if clustering has been performed. The silhouette score is a measure of how similar a region is to other regions in the same cluster as opposed to those in other clusters. It will be reported in the final column of the BED file with regions. The silhouette evaluation can be very slow when you have morethan 100 000 regions.
Optional arguments
- --version
show program's version number and exit
- --plotType
Possible choices: lines, fill, se, std
"lines" will plot the profile line based on the average type selected. "fill" fills the region between zero and the profile curve. The fill in color is semi transparent to distinguish different profiles. "se" and "std" color the region between the profile and the standard error or standard deviation of the data.
- --sortRegions
Possible choices: descend, ascend, no, keep
Whether the heatmap should present the regions sorted. The default is to sort in descending order based on the mean value per region. Note that "keep" and "no" are the same thing.
- --sortUsing
Possible choices: mean, median, max, min, sum, region_length
Indicate which method should be used for sorting. For each row the method is computed. For region_length, a dashed line is drawn at the end of the region (reference point TSS and center) or the beginning of the region (reference point TES) as appropriate.
- --sortUsingSamples
List of sample numbers (order as in matrix), which are used by --sortUsing for sorting. If no value is set, it uses all samples. Example: --sortUsingSamples 1 3
- --linesAtTickMarks
Draw dashed lines from all tick marks through the heatmap. This is then similar to the dashed line draw at region bounds when using a reference point and --sortUsing region_length
- --clusterUsingSamples
List of sample numbers (order as in matrix), that are used for clustering by --kmeans or --hclust if not given, all samples are taken into account for clustering. Example: --ClusterUsingSamples 1 3
- --averageTypeSummaryPlot
Possible choices: mean, median, min, max, std, sum
Define the type of statistic that should be plotted in the summary image above the heatmap. The options are: "mean", "median", "min", "max", "sum" and "std".
- --missingDataColor
If --missingDataAsZero was not set, such cases will be colored in black by default. Using this parameter, a different color can be set. A value between 0 and 1 will be used for a gray scale (black is 0). For a list of possible color names see: http://packages.python.org/ete2/reference/reference_svgcolors.html. Other colors can be specified using the #rrggbb notation.
- --colorMap
Color map to use for the heatmap. If more than one heatmap is being plotted the color of each heatmap can be enter individually (e.g. --colorMap Reds Blues). Color maps are recycled if the number of color maps is smaller than the number of heatmaps being plotted. Available values can be seen here: http://matplotlib.org/users/colormaps.html The available options are: 'magma', 'inferno', 'plasma', 'viridis', 'cividis', 'twilight', 'twilight_shifted', 'turbo', 'Blues', 'BrBG', 'BuGn', 'BuPu', 'CMRmap', 'GnBu', 'Greens', 'Greys', 'OrRd', 'Oranges', 'PRGn', 'PiYG', 'PuBu', 'PuBuGn', 'PuOr', 'PuRd', 'Purples', 'RdBu', 'RdGy', 'RdPu', 'RdYlBu', 'RdYlGn', 'Reds', 'Spectral', 'Wistia', 'YlGn', 'YlGnBu', 'YlOrBr', 'YlOrRd', 'afmhot', 'autumn', 'binary', 'bone', 'brg', 'bwr', 'cool', 'coolwarm', 'copper', 'cubehelix', 'flag', 'gist_earth', 'gist_gray', 'gist_heat', 'gist_ncar', 'gist_rainbow', 'gist_stern', 'gist_yarg', 'gnuplot', 'gnuplot2', 'gray', 'hot', 'hsv', 'jet', 'nipy_spectral', 'ocean', 'pink', 'prism', 'rainbow', 'seismic', 'spring', 'summer', 'terrain', 'winter', 'Accent', 'Dark2', 'Paired', 'Pastel1', 'Pastel2', 'Set1', 'Set2', 'Set3', 'tab10', 'tab20', 'tab20b', 'tab20c', 'grey', 'gist_grey', 'gist_yerg', 'Grays', 'rocket', 'mako', 'vlag', 'icefire'
- --alpha
The alpha channel (transparency) to use for the heatmaps. The default is 1.0 and values must be between 0 and 1.
- --colorList
List of colors to use to create a colormap. For example, if --colorList black,yellow,blue is set (colors separated by comas) then a color map that starts with black, continues to yellow and finishes in blue is created. If this option is selected, it overrides the --colorMap chosen. The list of valid color names can be seen here: http://matplotlib.org/examples/color/named_colors.html Hex colors are valid (e.g #34a2b1). If individual colors for different heatmaps need to be specified they need to be separated by space as for example: --colorList "white,#cccccc" "white,darkred" As for --colorMap, the color lists are recycled if their number is smaller thatn the number ofplotted heatmaps. The number of transitions is defined by the --colorNumber option.
- --colorNumber
N.B., --colorList is required for an effect. This controls the number of transitions from one color to the other. If --colorNumber is the number of colors in --colorList then there will be no transitions between the colors.
- --zMin, -min
Minimum value for the heatmap intensities. Multiple values, separated by spaces can be set for each heatmap. If the number of zMin values is smaller thanthe number of heatmaps the values are recycled. If a value is set to "auto", it will be set to the first percentile of the matrix values.
- --zMax, -max
Maximum value for the heatmap intensities. Multiple values, separated by spaces can be set for each heatmap. If the number of zMax values is smaller thanthe number of heatmaps the values are recycled. If a value is set to "auto", it will be set to the 98th percentile of the matrix values.
- --heatmapHeight
Plot height in cm. The default for the heatmap height is 28. The minimum value is 3 and the maximum is 100.
- --heatmapWidth
Plot width in cm. The default value is 4 The minimum value is 1 and the maximum is 100.
- --whatToShow
Possible choices: plot, heatmap and colorbar, plot and heatmap, heatmap only, heatmap and colorbar
The default is to include a summary or profile plot on top of the heatmap and a heatmap colorbar. Other options are: "plot and heatmap", "heatmap only", "heatmap and colorbar", and the default "plot, heatmap and colorbar".
- --boxAroundHeatmaps
By default black boxes are plot around heatmaps. This can be turned off by setting --boxAroundHeatmaps no
- --xAxisLabel, -x
Description for the x-axis label.
- --startLabel
[only for scale-regions mode] Label shown in the plot for the start of the region. Default is TSS (transcription start site), but could be changed to anything, e.g. "peak start". Same for the --endLabel option. See below.
- --endLabel
[only for scale-regions mode] Label shown in the plot for the region end. Default is TES (transcription end site).
- --refPointLabel
[only for reference-point mode] Label shown in the plot for the reference-point. Default is the same as the reference point selected (e.g. TSS), but could be anything, e.g. "peak start".
- --labelRotation
Rotation of the X-axis labels in degrees. The default is 0, positive values denote a counter-clockwise rotation.
- --regionsLabel, -z
Labels for the regions plotted in the heatmap. If more than one region is being plotted, a list of labels separated by spaces is required. If a label itself contains a space, then quotes are needed. For example, --regionsLabel label_1, "label 2".
- --samplesLabel
Labels for the samples plotted. The default is to use the file name of the sample. The sample labels should be separated by spaces and quoted if a label itselfcontains a space E.g. --samplesLabel label-1 "label 2"
- --plotTitle, -T
Title of the plot, to be printed on top of the generated image. Leave blank for no title.
- --yAxisLabel, -y
Y-axis label for the top panel.
- --yMin
Minimum value for the Y-axis. Multiple values, separated by spaces can be set for each profile. If the number of yMin values is smaller thanthe number of plots, the values are recycled.
- --yMax
Maximum value for the Y-axis. Multiple values, separated by spaces can be set for each profile. If the number of yMin values is smaller thanthe number of plots, the values are recycled.
- --legendLocation
Possible choices: best, upper-right, upper-left, upper-center, lower-left, lower-right, lower-center, center, center-left, center-right, none
Location for the legend in the summary plot. Note that "none" does not work for the profiler.
- --perGroup
The default is to plot all groups of regions by sample. Using this option instead plots all samples by group of regions. Note that this is only useful if you have multiple groups of regions. by sample rather than group.
- --plotFileFormat
Possible choices: png, pdf, svg, eps, plotly
Image format type. If given, this option overrides the image format based on the plotFile ending. The available options are: "png", "eps", "pdf", "plotly" and "svg"
- --verbose
If set, warning messages and additional information are given.
An example usage is: plotHeatmap -m matrix.gz
细节
备注
随着deeptools 2.3的发布,现在可以单独设置每个heatmap的颜色和比例。此外,我们还添加了移除热图周围的框的选项。
plotHeatmap 不会更改 computeMatrix 经过计算,它简单地将它们转换成热图和汇总图。它提供了各种各样的参数来探索各种可视化效果并自定义生成的图像(请参见上面的命令)。
此外,还可以检索各种绘图的所有数据表,包括用于生成最终绘图的区域。下表总结了三种工具可用的可选输出类型。
可选输出类型 |
command |
computeMatrix |
plotHeatmap |
plotProfile |
热量的基础值 |
|
对 |
对 |
不 |
配置文件的基础值 |
|
不 |
对 |
对 |
排序和/或筛选区域 |
|
对 |
对 |
对 |
小技巧
有关可选输出的更多详细信息,请参阅 计算机 .
使用实例
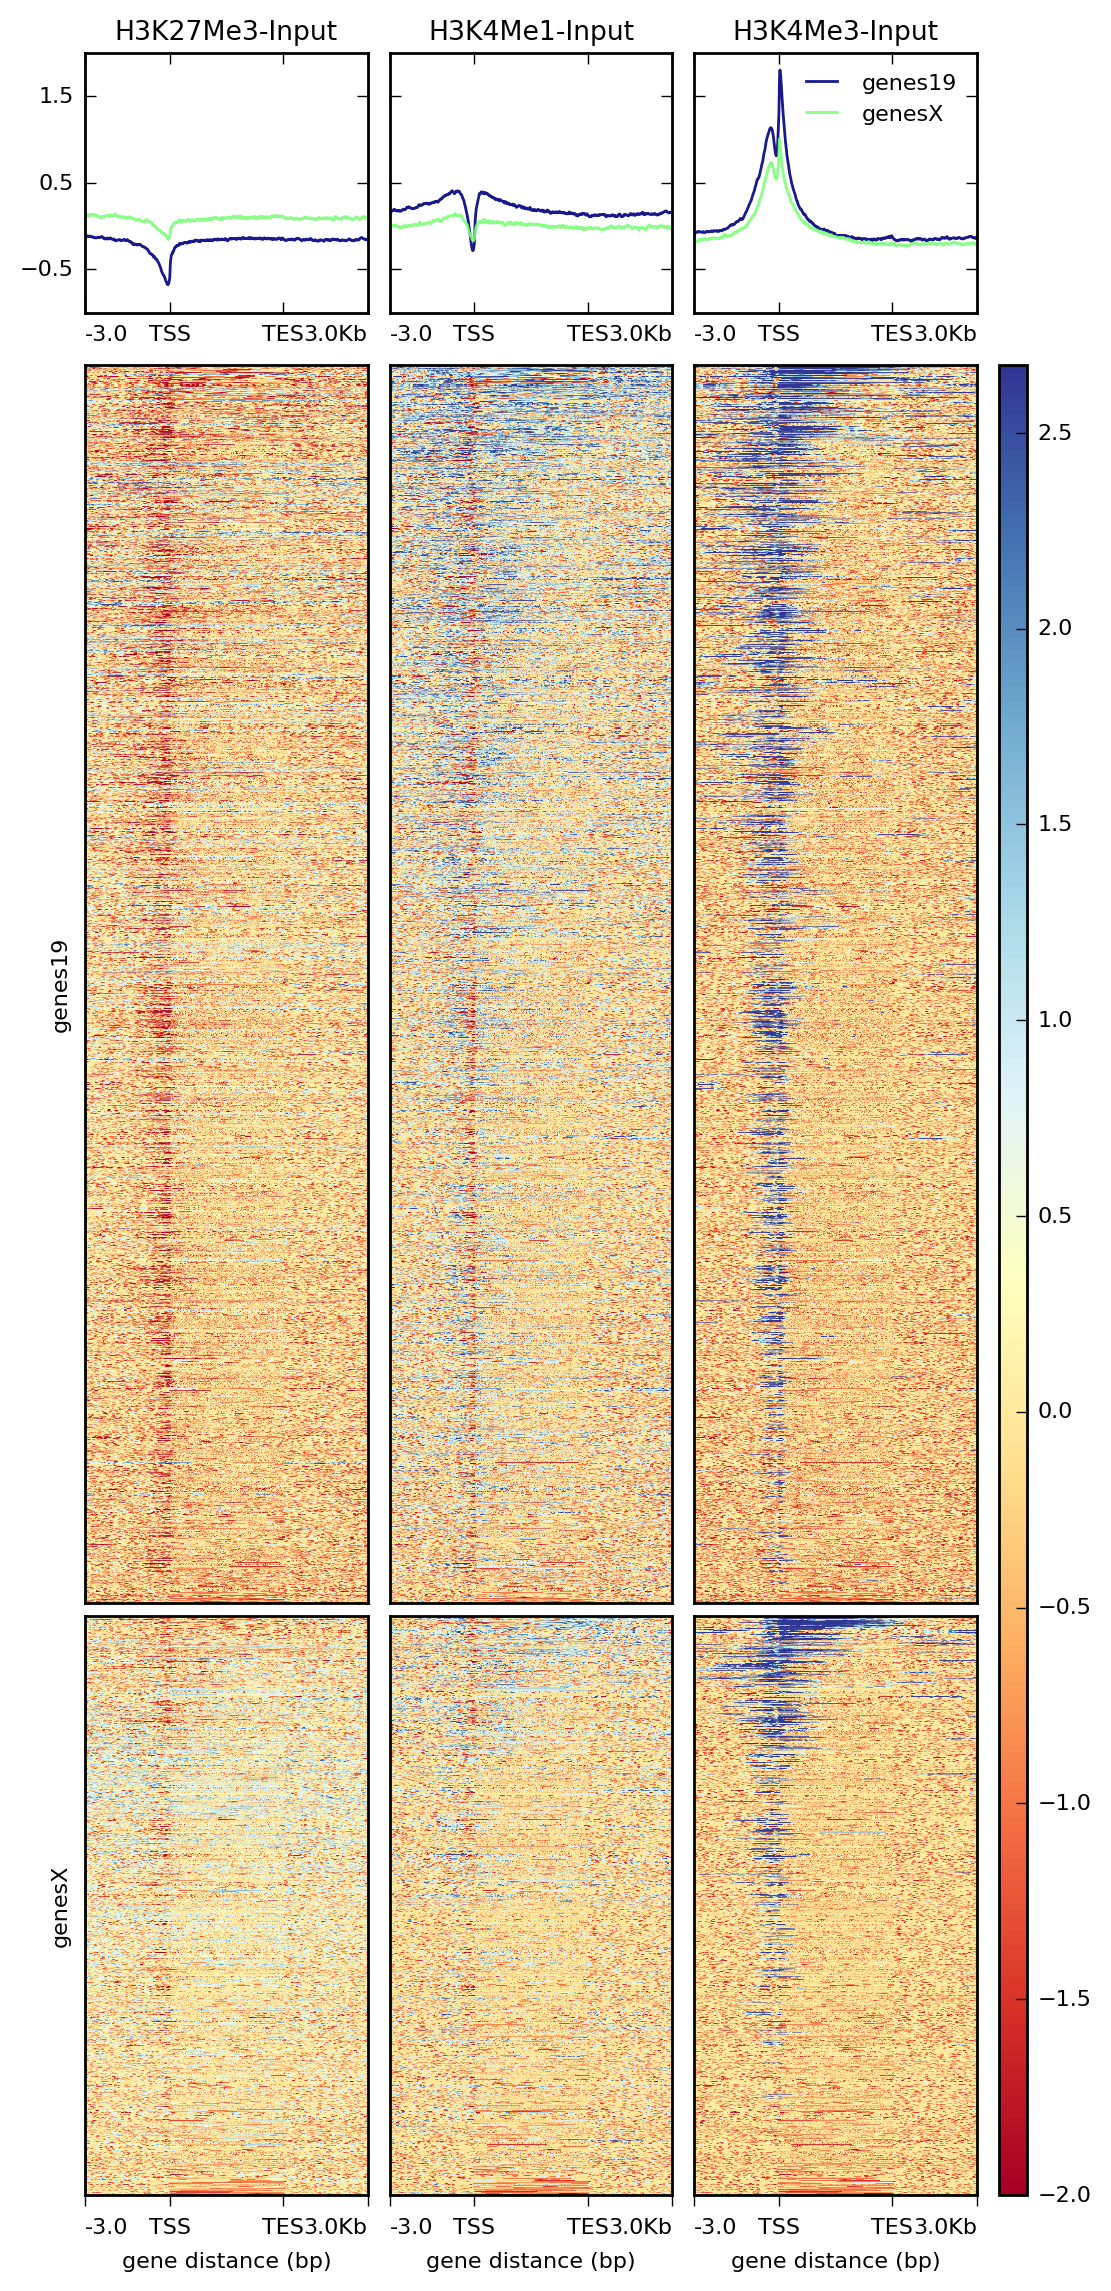
下面的示例为我们的测试编码数据集在hg19转录上创建一个heatmap。注意,基质包含多组区域(在本例中,每个使用的染色体一组)。
# run compute matrix to collect the data needed for plotting
$ computeMatrix scale-regions -S H3K27Me3-input.bigWig \
                                 H3K4Me1-Input.bigWig  \
                                 H3K4Me3-Input.bigWig \
                              -R genes19.bed genesX.bed \
                              --beforeRegionStartLength 3000 \
                              --regionBodyLength 5000 \
                              --afterRegionStartLength 3000
                              --skipZeros -o matrix.mat.gz

$ plotHeatmap -m matrix.mat.gz \
      -out ExampleHeatmap1.png \
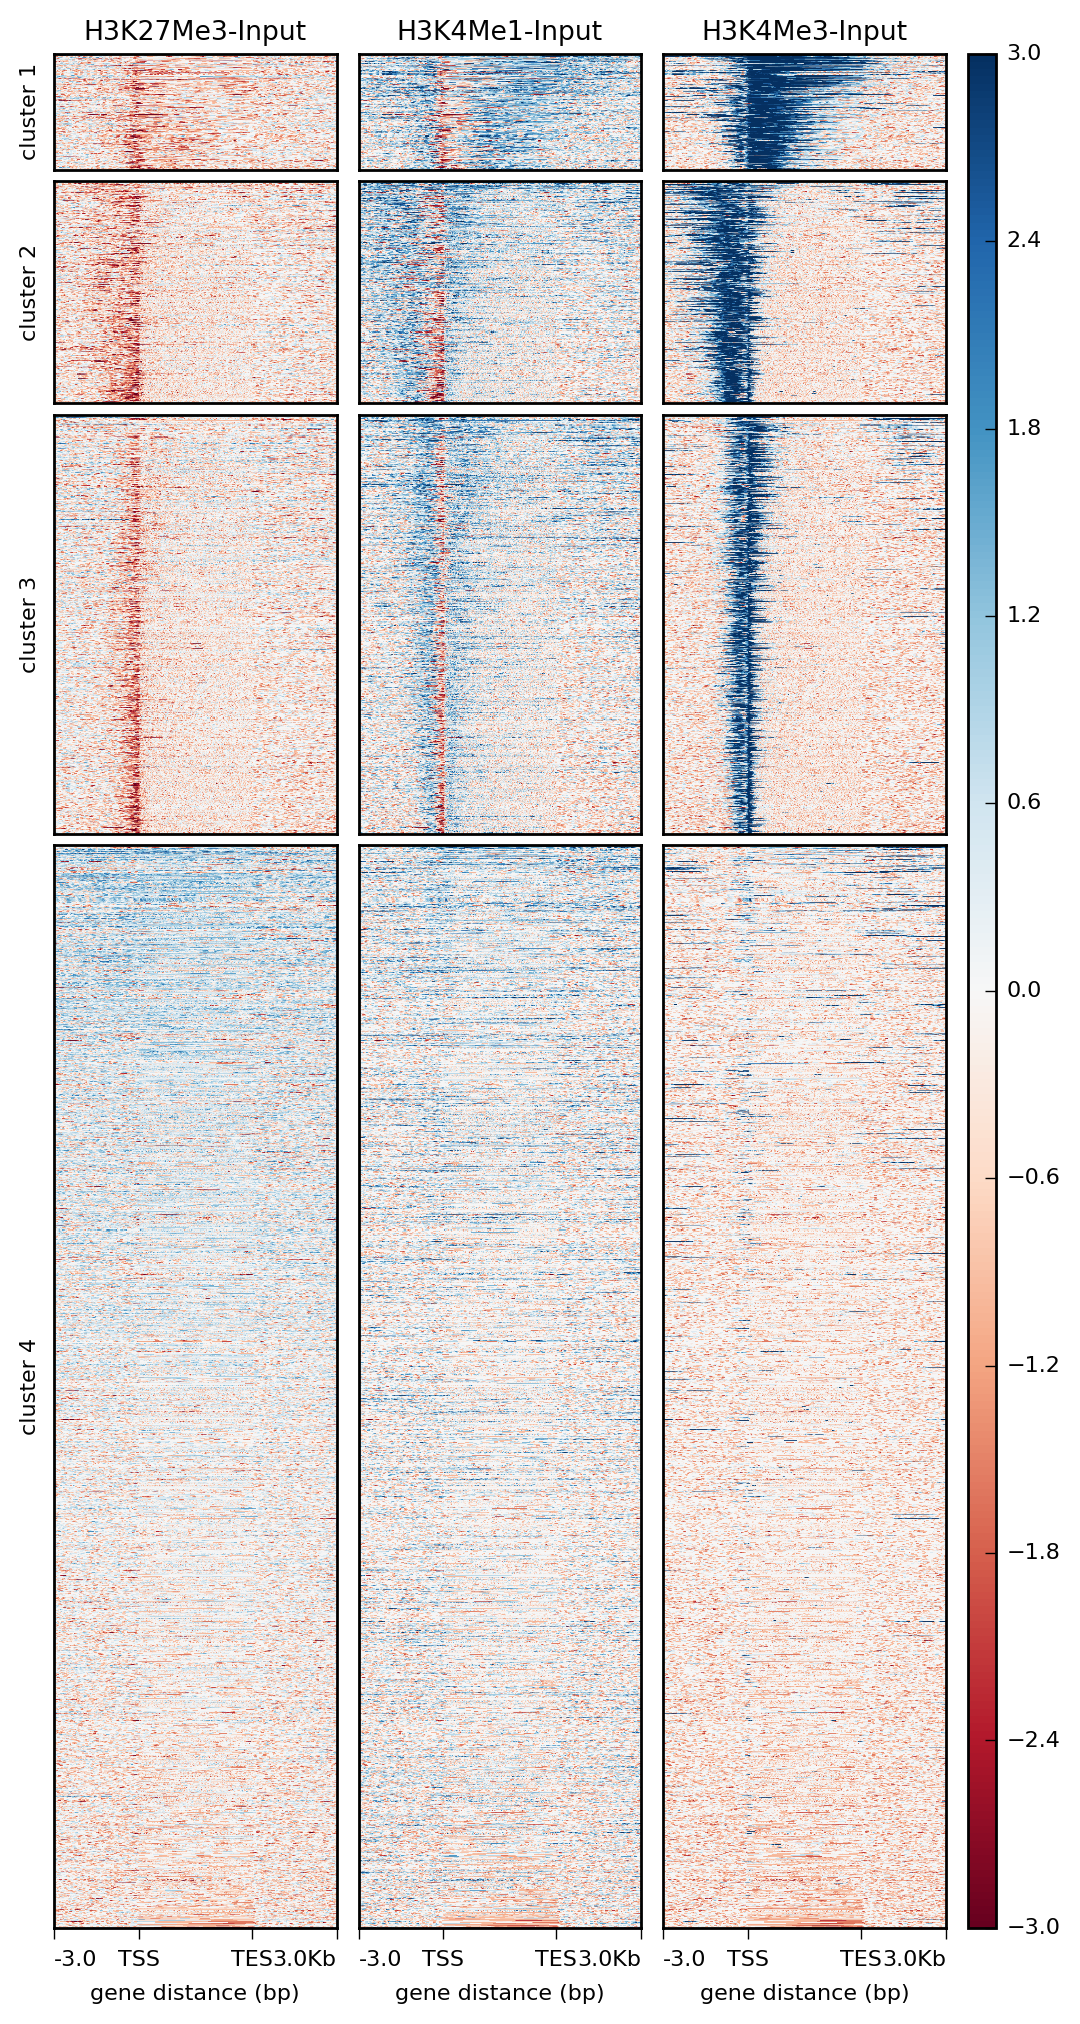
如上所述, plotHeatmap 有很多选择,包括做K-均值聚类和改变颜色地图的能力。
$ plotHeatmap -m matrix_two_groups.gz \
     -out ExampleHeatmap2.png \
     --colorMap RdBu \
     --whatToShow 'heatmap and colorbar' \
     --zMin -3 --zMax 3 \
     --kmeans 4
小技巧
更多例子 在我们的 Gallery .
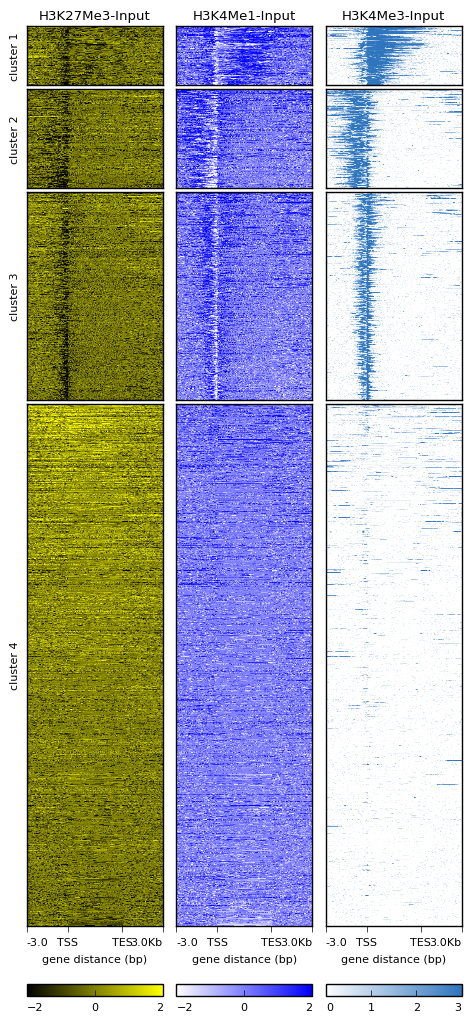
多种颜色的热图
由于Deeptools版本2.3,现在可以调整每个heatmap的颜色和比例。有两种方法可以调整颜色,一种是通过指定每个颜色映射(例如 --colorMap RdBlGr winter terrain )另一种方法是在热图中给出每种颜色(例如 --colorList 'red,blue' 'white,green', 'white, blue, red' )对于第二个示例,颜色之间的转换次数由 --colorNumber 默认为256。
下面是一个使用 --colorList 方法。此外,还可以使用 --zMin 和 --zMax .
$ plotHeatmap -m matrix_two_groups.gz \
     -out ExampleHeatmap3.png \
     --colorList 'black, yellow' 'white,blue' '#ffffff,orange,#000000'
     --whatToShow 'heatmap and colorbar' \
     --zMin -2 -2 0 --zMax 2 2 3
     --kmeans 4
     --dpi 100
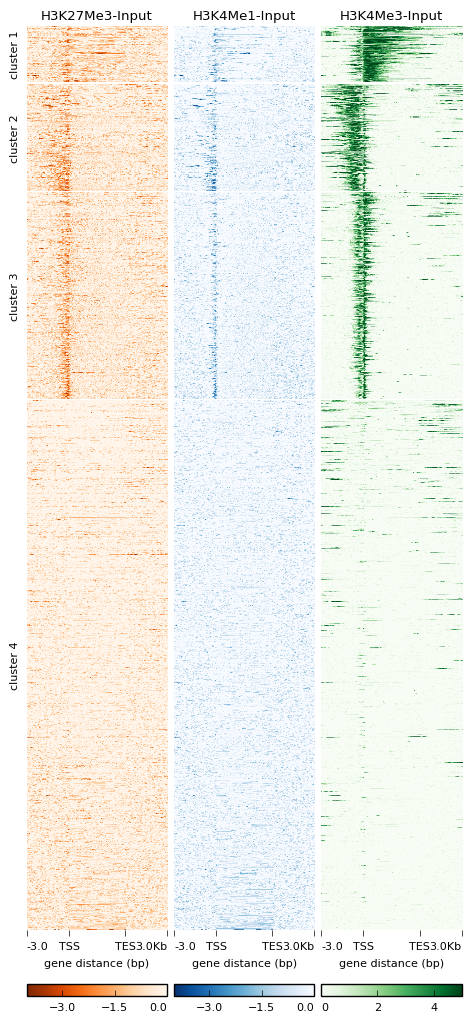
热天周围没有盒子
在版本2.3中,我们还添加了移除heatmap周围的框的选项。在下面的示例中,我们将不同的颜色映射颜色、不同的比例和新的 --boxAroundHeatmaps 选择权。
$ plotHeatmap -m matrix_two_groups.gz \
     -out ExampleHeatmap4.png \
     --colorMap Oranges_r Blues_r Greens
     --whatToShow 'heatmap and colorbar' \
     --zMin -4 -4 0 --zMax 0 0 5
     --kmeans 4
     --dpi 100
     --boxAroundHeatmaps no
小技巧
更多例子 在我们的 Gallery .
deepTools Galaxy <http://deeptools.ie-freiburg.mpg.de> _. |
code @ github <https://github.com/deeptools/deepTools/> _. |