绘图针打印
如果您在Chip Seq实验中把Chip Seq样品作为一个紧迫的问题来处理,那么这种质量控制对您来说很有可能是最感兴趣的:“我的芯片工作了吗?”也就是说,抗体处理是否足够丰富,以便芯片信号与背景信号分离?(毕竟,在芯片实验中,大约90%的DNA片段将代表基因组背景)。
备注
我们把这里描述的图称为“指纹”,因为我们觉得它们帮助我们判断单个芯片序列文件,但最初的想法来自 Diaz et al.
This tool samples indexed BAM files and plots a profile of cumulative read coverages for each. All reads overlapping a window (bin) of the specified length are counted; these counts are sorted and the cumulative sum is finally plotted.
usage: plotFingerprint -b treatment.bam control.bam -plot fingerprint.png
help: plotFingerprint -h / plotFingerprint --help
Required arguments
- --bamfiles, -b
List of indexed BAM files
Output
- --plotFile, -plot, -o
File name of the output figure. The file ending will be used to determine the image format. The available options are typically: "png", "eps", "pdf" and "svg", e.g. : fingerprint.png.
- --outRawCounts
Output file name to save the read counts per bin.
Read processing options
- --extendReads, -e
This parameter allows the extension of reads to fragment size. If set, each read is extended, without exception. NOTE: This feature is generally NOT recommended for spliced-read data, such as RNA-seq, as it would extend reads over skipped regions. Single-end: Requires a user specified value for the final fragment length. Reads that already exceed this fragment length will not be extended. Paired-end: Reads with mates are always extended to match the fragment size defined by the two read mates. Unmated reads, mate reads that map too far apart (>4x fragment length) or even map to different chromosomes are treated like single-end reads. The input of a fragment length value is optional. If no value is specified, it is estimated from the data (mean of the fragment size of all mate reads).
- --ignoreDuplicates
If set, reads that have the same orientation and start position will be considered only once. If reads are paired, the mate's position also has to coincide to ignore a read.
- --minMappingQuality
If set, only reads that have a mapping quality score of at least this are considered.
- --centerReads
By adding this option, reads are centered with respect to the fragment length. For paired-end data, the read is centered at the fragment length defined by the two ends of the fragment. For single-end data, the given fragment length is used. This option is useful to get a sharper signal around enriched regions.
- --samFlagInclude
Include reads based on the SAM flag. For example, to get only reads that are the first mate, use a flag of 64. This is useful to count properly paired reads only once, as otherwise the second mate will be also considered for the coverage. (Default: None)
- --samFlagExclude
Exclude reads based on the SAM flag. For example, to get only reads that map to the forward strand, use --samFlagExclude 16, where 16 is the SAM flag for reads that map to the reverse strand. (Default: None)
- --minFragmentLength
The minimum fragment length needed for read/pair inclusion. This option is primarily useful in ATACseq experiments, for filtering mono- or di-nucleosome fragments. (Default: 0)
- --maxFragmentLength
The maximum fragment length needed for read/pair inclusion. (Default: 0)
Optional arguments
- --labels, -l
List of labels to use in the output. If not given, the file names will be used instead. Separate the labels by spaces.
- --smartLabels
Instead of manually specifying labels for the input BAM/bigWig files, this causes deepTools to use the file name after removing the path and extension.
- --binSize, -bs
Window size in base pairs to sample the genome. This times --numberOfSamples should be less than the genome size. (Default: 500)
- --numberOfSamples, -n
The number of bins that are sampled from the genome, for which the overlapping number of reads is computed. (Default: 500000.0)
- --plotFileFormat
Possible choices: png, pdf, svg, eps, plotly
image format type. If given, this option overrides the image format based on the ending given via --plotFile ending. The available options are: "png", "eps", "pdf", "plotly" and "svg"
- --plotTitle, -T
Title of the plot, to be printed on top of the generated image. Leave blank for no title. (Default: )
- --skipZeros
If set, then regions with zero overlapping readsfor all given BAM files are ignored. This will result in a reduced number of read counts than that specified in --numberOfSamples
- --outQualityMetrics
Quality metrics can optionally be output to this file. The file will have one row per input BAM file and columns containing a number of metrics. Please see the online documentation for a longer explanation: http://deeptools.readthedocs.io/en/latest/content/feature/plotFingerprint_QC_metrics.html .
- --JSDsample
Reference sample against which to compute the Jensen-Shannon distance and the CHANCE statistics. If this is not specified, then these will not be calculated. If --outQualityMetrics is not specified then this will be ignored. The Jensen-Shannon implementation is based on code from Sitanshu Gakkhar at BCGSC. The CHANCE implementation is based on code from Matthias Haimel.
- --version
show program's version number and exit
- --region, -r
Region of the genome to limit the operation to - this is useful when testing parameters to reduce the computing time. The format is chr:start:end, for example --region chr10 or --region chr10:456700:891000.
- --blackListFileName, -bl
A BED or GTF file containing regions that should be excluded from all analyses. Currently this works by rejecting genomic chunks that happen to overlap an entry. Consequently, for BAM files, if a read partially overlaps a blacklisted region or a fragment spans over it, then the read/fragment might still be considered. Please note that you should adjust the effective genome size, if relevant.
- --numberOfProcessors, -p
Number of processors to use. Type "max/2" to use half the maximum number of processors or "max" to use all available processors. (Default: 1)
- --verbose, -v
Set to see processing messages.
背景
此工具基于 Diaz et al. . 它决定了芯片序列样本中的信号与控制样本中读取的背景分布的区别程度。对于将丰富定义明确、相当狭窄区域的因子(例如转录因子,如p300),所得图可用于评估芯片的强度,但预计丰富程度越大,图就越不清晰。反之亦然,如果您不知道期望的信号类型,指纹图将直接指示您在下游分析过程中必须多么小心才能将生物噪声与有意义的信号分离。
类似 multiBamSummary , plotFingerprint 随机抽取特定长度的基因组区域(bins),并将索引中的每个碱基覆盖率相加。 [BAM] 与这些区域重叠的文件。然后,根据这些值的等级对其进行排序,并绘制读取计数的累积和。
情节告诉你什么
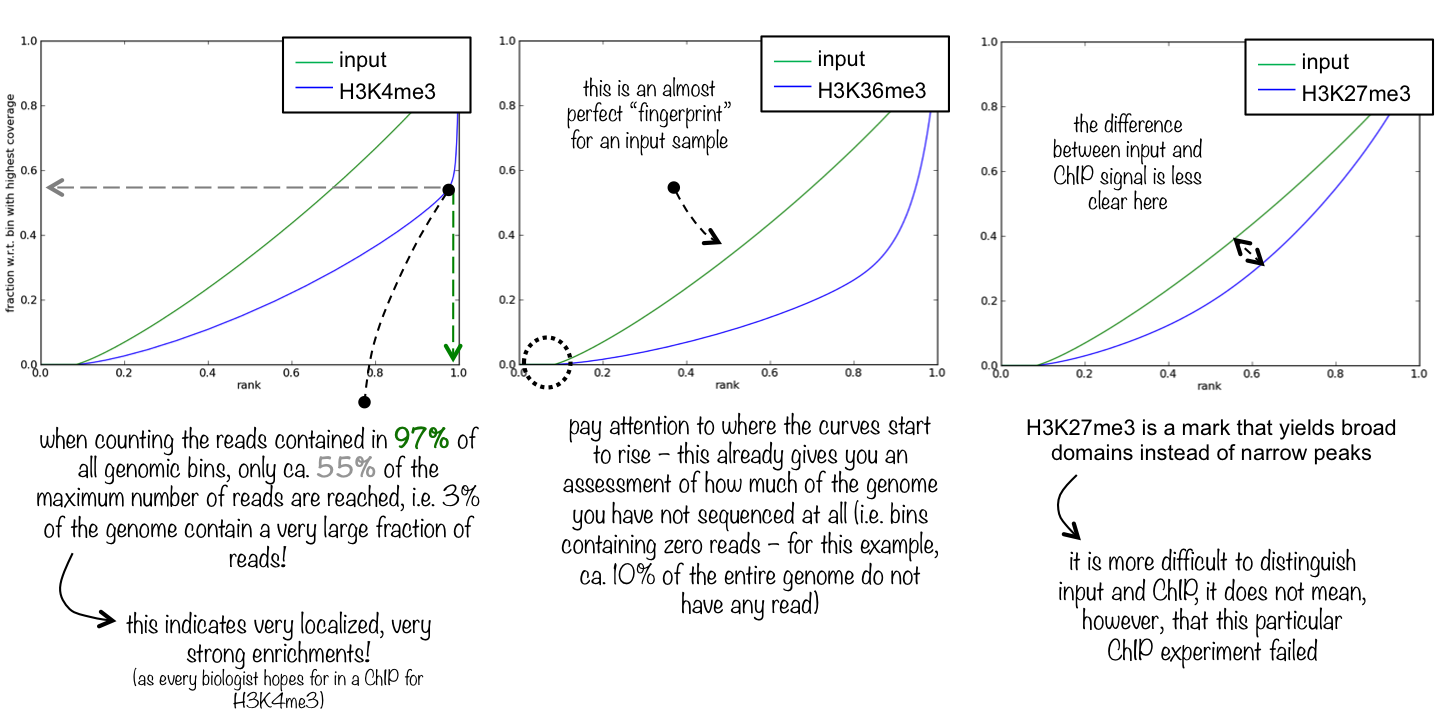
理想 [输入] []具有沿着基因组的完全均匀分布的读取(即,在开放染色质中没有丰富的内容等),无限的序列覆盖应该产生一条直线对角线。一个非常具体和强大的芯片富集将表明一个突出和急剧上升的累积和最高的排名。这意味着从芯片样本中读取的大量数据位于少数的容器中,这些容器对应于转录因子典型的高、窄的富集。
这里你看到3个不同的指纹图。我们选择这些例子来向您展示芯片信号的性质(窄和高与宽,而不是极高)是如何反映在“指纹”图中的。
质量控制指标
有关质量控制指标的详细说明,请参见: 打印质量控制指标 .
使用实例
下面的示例生成受邀编码组蛋白标记芯片seq数据集及其相应输入的指纹(聚焦于19号染色体,从而调整使用 --numberOfSamples 避免箱子重叠)。
$ deepTools2.0/bin/plotFingerprint \
 -b testFiles/*bam \
--labels H3K27me3 H3K4me1 H3K4me3 H3K9me3 input \
--minMappingQuality 30 --skipZeros \
--region 19 --numberOfSamples 50000 \
-T "Fingerprints of different samples"  \
--plotFile fingerprints.png \
--outRawCounts fingerprints.tab
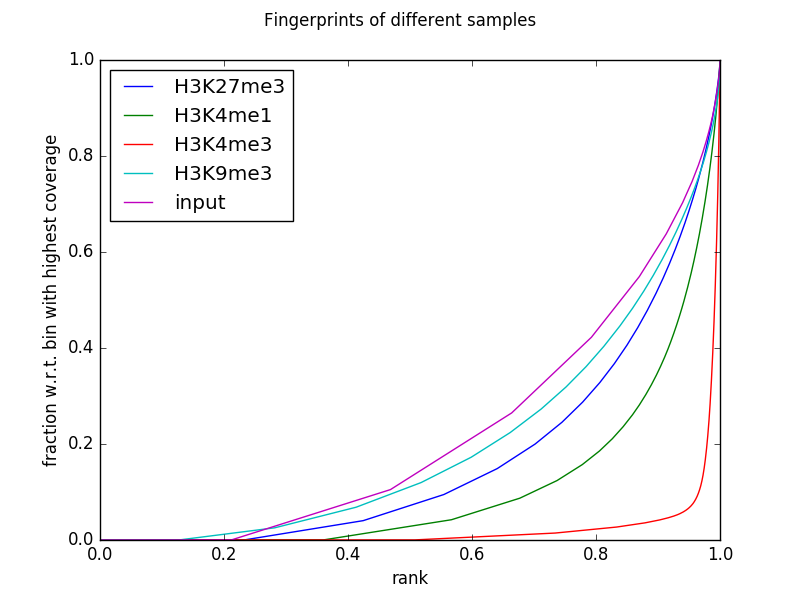
您可以通过获取的表 --outRawCounts 只包含每个样本基因组仓内每个碱基覆盖的总和。对于上面的绘图,每列都按递增顺序排序,然后绘制累积和。
$ head fingerprints.tab
  #plotFingerprint --outRawCounts
  'H3K27me3'  'H3K4me1'       'H3K4me3'       'H3K9me3'       'input'
      1       0       0       0       0
      0       0       0       0       1
      0       1       0       0       0
      12      0       0       3       3
      3       0       1       1       0
      6       4       0       1       0
      1       0       0       0       0
      4       1       1       1       0
      1       0       0       0       0
deepTools Galaxy <http://deeptools.ie-freiburg.mpg.de> _. |
code @ github <https://github.com/deeptools/deepTools/> _. |