绘图平均值
This tool is useful to assess the sequencing depth of a given sample. It samples 1 million bp, counts the number of overlapping reads and can report a histogram that tells you how many bases are covered how many times. Multiple BAM files are accepted, but they all should correspond to the same genome assembly.
- detailed usage help:
$ plotCoverage -h
usage: plotCoverage -b sample1.bam sample2.bam -o coverage.png
help: plotCoverage -h / plotCoverage --help
Named Arguments
- --version
show program's version number and exit
Required arguments
- --bamfiles, -b
List of indexed BAM files separated by spaces.
Optional arguments
- --plotFile, -o
File name to save the plot to.
- --labels, -l
User defined labels instead of default labels from file names. Multiple labels have to be separated by spaces, e.g. --labels sample1 sample2 sample3
- --smartLabels
Instead of manually specifying labels for the input BAM files, this causes deepTools to use the file name after removing the path and extension.
- --plotTitle, -T
Title of the plot, to be printed on top of the generated image. Leave blank for no title. (Default: )
- --skipZeros
By setting this option, genomic regions that have zero or nan values in _all_ samples are excluded.
- --numberOfSamples, -n
Number of 1 bp regions to sample. (Default: 1000000)
- --BED
Limits the coverage analysis to the regions specified in these files. This overrides --numberOfSamples. Due to memory requirements, it is inadvised to combine this with --outRawCounts or many tens of thousands of regions, as per-base coverage is used!
- --outRawCounts
Save raw counts (coverages) to file.
- --outCoverageMetrics
Save percentage of bins/regions above the specified thresholds to the specified file. The coverage thresholds are specified by --coverageThresholds. If no coverage thresholds are specified, the file will be empty.
- --coverageThresholds, -ct
The percentage of reported bins/regions with signal at least as high as the given threshold. This can be specified multiple times.
- --plotHeight
Plot height in cm. (Default: 5.0)
- --plotWidth
Plot width in cm. The minimum value is 1 cm. (Default: 15.0)
- --plotFileFormat
Possible choices: png, pdf, svg, eps, plotly
Image format type. If given, this option overrides the image format based on the plotFile ending. The available options are: png, eps, pdf, svg and plotly.
- --region, -r
Region of the genome to limit the operation to - this is useful when testing parameters to reduce the computing time. The format is chr:start:end, for example --region chr10 or --region chr10:456700:891000.
- --blackListFileName, -bl
A BED or GTF file containing regions that should be excluded from all analyses. Currently this works by rejecting genomic chunks that happen to overlap an entry. Consequently, for BAM files, if a read partially overlaps a blacklisted region or a fragment spans over it, then the read/fragment might still be considered. Please note that you should adjust the effective genome size, if relevant.
- --numberOfProcessors, -p
Number of processors to use. Type "max/2" to use half the maximum number of processors or "max" to use all available processors. (Default: 1)
- --verbose, -v
Set to see processing messages.
Read processing options
- --extendReads, -e
This parameter allows the extension of reads to fragment size. If set, each read is extended, without exception. NOTE: This feature is generally NOT recommended for spliced-read data, such as RNA-seq, as it would extend reads over skipped regions. Single-end: Requires a user specified value for the final fragment length. Reads that already exceed this fragment length will not be extended. Paired-end: Reads with mates are always extended to match the fragment size defined by the two read mates. Unmated reads, mate reads that map too far apart (>4x fragment length) or even map to different chromosomes are treated like single-end reads. The input of a fragment length value is optional. If no value is specified, it is estimated from the data (mean of the fragment size of all mate reads).
- --ignoreDuplicates
If set, reads that have the same orientation and start position will be considered only once. If reads are paired, the mate's position also has to coincide to ignore a read.
- --minMappingQuality
If set, only reads that have a mapping quality score of at least this are considered.
- --centerReads
By adding this option, reads are centered with respect to the fragment length. For paired-end data, the read is centered at the fragment length defined by the two ends of the fragment. For single-end data, the given fragment length is used. This option is useful to get a sharper signal around enriched regions.
- --samFlagInclude
Include reads based on the SAM flag. For example, to get only reads that are the first mate, use a flag of 64. This is useful to count properly paired reads only once, as otherwise the second mate will be also considered for the coverage. (Default: None)
- --samFlagExclude
Exclude reads based on the SAM flag. For example, to get only reads that map to the forward strand, use --samFlagExclude 16, where 16 is the SAM flag for reads that map to the reverse strand. (Default: None)
- --minFragmentLength
The minimum fragment length needed for read/pair inclusion. This option is primarily useful in ATACseq experiments, for filtering mono- or di-nucleosome fragments. (Default: 0)
- --maxFragmentLength
The maximum fragment length needed for read/pair inclusion. (Default: 0)
example usages: plotCoverage --bamfiles file1.bam file2.bam -o results.png
情节告诉你什么
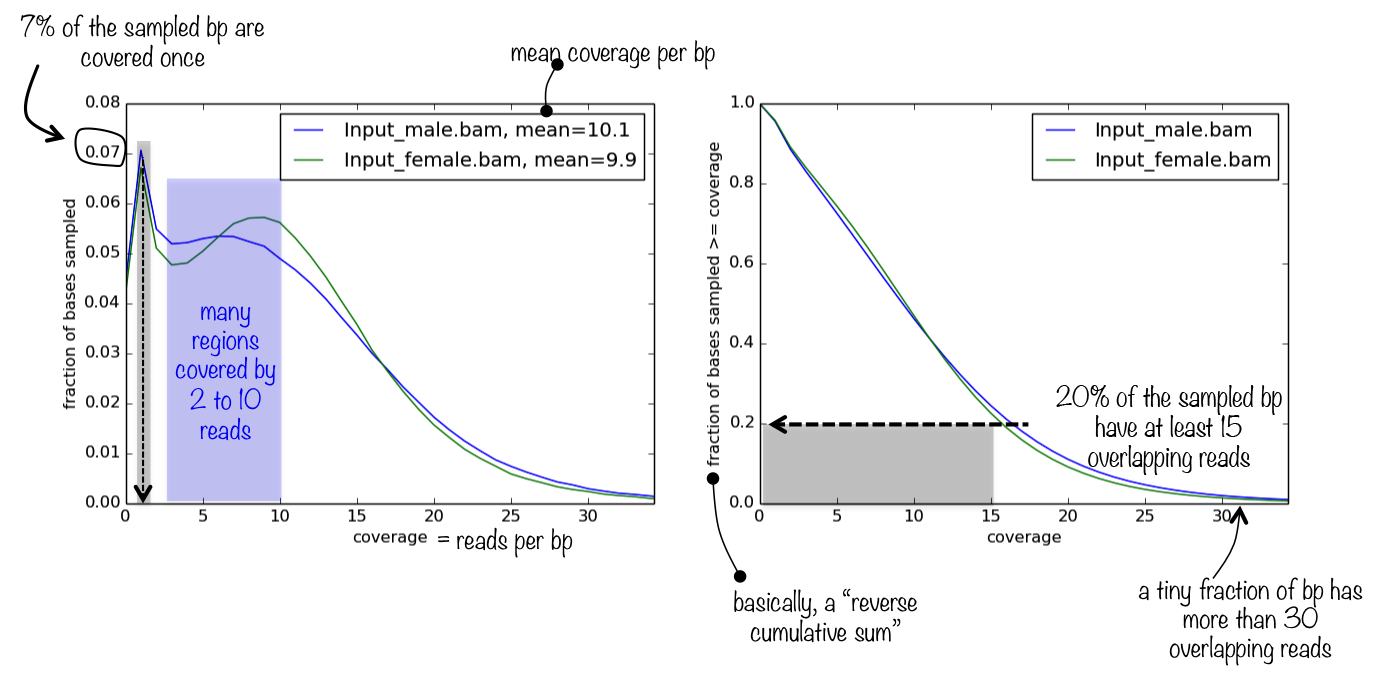
该工具生成一个包含两个绘图的面板。第一个简单地表示找到的读覆盖率的频率,这有助于判断平均覆盖率值(打印在样本名称旁边)的相关性。如果读覆盖率的分布或多或少是同构的,理想情况下是正态分布(很可能不会),那么平均值是一个非常适合的排序深度的代理。
第二个情节帮助你回答问题 基因组中深度排序为2的部分是什么?
使用实例
 $ plotCoverage -b H3K4Me1.bam H3K4Me3.bam H3K27Me3.bam H3K9Me3.bam
    --plotFile example_coverage
    -n 1000000
    --plotTitle "example_coverage" \
    --outRawCounts coverage.tab \
    --ignoreDuplicates \
    --minMappingQuality 10 \
    --region 19

# have a look at the optional tabular output: each row represents the number of reads overlapping with a sampled bp
$ head coverage.tab
    'H3K27me3'        'H3K4me1'       'H3K4me3'       'H3K9me3'
    0 0       0       0
    0 0       0       0
    0 0       0       0
    0 0       0       0
    0 0       0       0
    0 0       0       0
    0 0       0       0
    0 0       0       0
    0 0       0       0

$ cut -f1 coverage.tab | sort -n | uniq -c
    1 'H3K27me3'
    548190 0 # the vast majority of sampled bp had 0 overlapping reads
    127914 1
    35703 2
    12271 3
    4584 4
    1717 5
     659 6
     251 7
     106 8
      49 9
      16 10
       6 11
       3 12
       2 13
       3 14
       1 15
       1 16
       2 17
       1 19
       1 21
       2 22
       1 23
       1 24
       2 28
       1 35
       1 40 # there was one bp with 40 overlapping reads!
       1 44
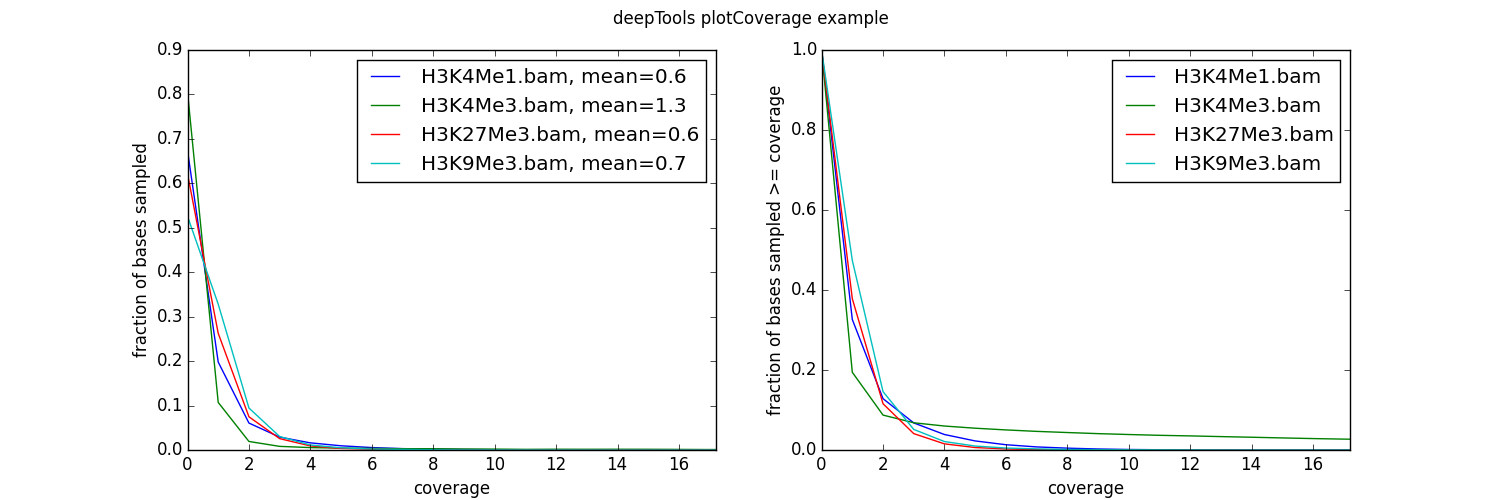
如您所见,我们的测试数据集的覆盖率非常低——平均来说,每个bp的读取次数少于1次!
deepTools Galaxy <http://deeptools.ie-freiburg.mpg.de> _. |
code @ github <https://github.com/deeptools/deepTools/> _. |