scipy.stats.yeojohnson
- scipy.stats.yeojohnson(x, lmbda=None)[源代码]
返回由Yeo-Johnson幂变换转换的数据集。
- 参数
- xndarray
输入数组。应该是一维的。
- lmbda浮动,可选
如果
lmbda是None,找到最大化对数似然函数的λ,并将其作为第二个输出参数返回。否则,对给定值执行转换。
- 退货
- 约约翰森:ndarray
YEO-JONSON幂变换阵列。
- maxlog浮动,可选
如果 lmbda 参数为NONE,则返回的第二个参数是最大化对数似然函数的lambda。
注意事项
Yeo-Johnson变换由以下公式给出:
y = ((x + 1)**lmbda - 1) / lmbda,                for x >= 0, lmbda != 0
    log(x + 1),                                  for x >= 0, lmbda = 0
    -((-x + 1)**(2 - lmbda) - 1) / (2 - lmbda),  for x < 0, lmbda != 2
    -log(-x + 1),                                for x < 0, lmbda = 2
不像
boxcox,yeojohnson不要求输入数据为正数。1.2.0 新版功能.
参考文献
I.Yeo和R.A.Johnson,“改善正规性或对称性的一族新的幂变换”,Biuliska 87.4(2000):
示例
>>> from scipy import stats
>>> import matplotlib.pyplot as plt
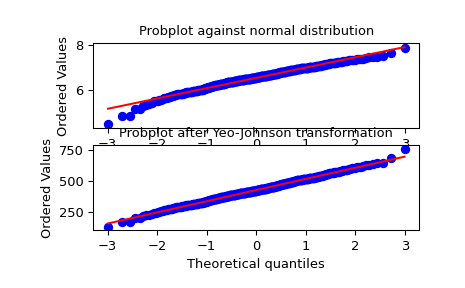
我们从一个非正态分布中产生一些随机变量,并对它做一个概率图,以表明它在尾部是非正态的:
>>> fig = plt.figure()
>>> ax1 = fig.add_subplot(211)
>>> x = stats.loggamma.rvs(5, size=500) + 5
>>> prob = stats.probplot(x, dist=stats.norm, plot=ax1)
>>> ax1.set_xlabel('')
>>> ax1.set_title('Probplot against normal distribution')
我们现在使用的是
yeojohnson要转换数据以使其最接近正常,请执行以下操作:>>> ax2 = fig.add_subplot(212) >>> xt, lmbda = stats.yeojohnson(x) >>> prob = stats.probplot(xt, dist=stats.norm, plot=ax2) >>> ax2.set_title('Probplot after Yeo-Johnson transformation')
>>> plt.show()