pandas.plotting.lag_plot#
- pandas.plotting.lag_plot(series, lag=1, ax=None, **kwds)[源代码]#
时间序列的滞后图。
- 参数
- series时间序列
- lag散点图的滞后,默认为1
- axMatplotlib轴对象,可选
- **kwds
Matplotlib散布方法关键字参数。
- 退货
- 类:matplotlib.axis.Axes
示例
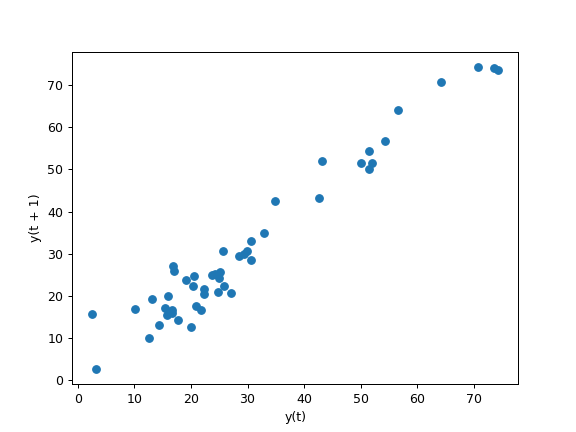
滞后图最常用于在时间序列数据中寻找模式。
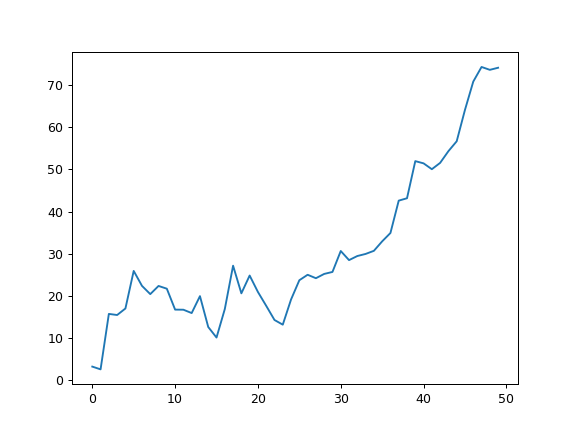
给定以下时间序列
>>> np.random.seed(5)
>>> x = np.cumsum(np.random.normal(loc=1, scale=5, size=50))
>>> s = pd.Series(x)
>>> s.plot()
<AxesSubplot:xlabel='Midrange'>
与……的滞后情节
lag=1退货>>> pd.plotting.lag_plot(s, lag=1) <AxesSubplot:xlabel='y(t)', ylabel='y(t + 1)'>