pandas.plotting.bootstrap_plot#
- pandas.plotting.bootstrap_plot(series, fig=None, size=50, samples=500, **kwds)[源代码]#
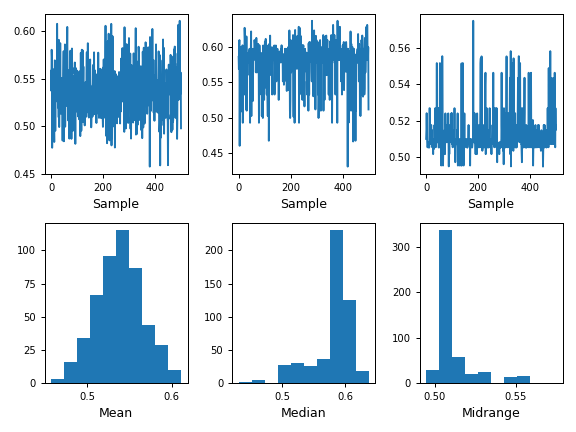
均值、中值和中值统计的自助图。
用Bootstrap图通过随机抽样和替换来估计统计量的不确定度 [1]. 此函数将为给定大小的给定数量的样本生成平均值、中值和中值统计数据的自举图。
- 1
Https://en.wikipedia.org/wiki/Bootstrapping_%28statistics%29中的“自举(统计)”
- 参数
- seriespandas.Series
系列从哪里获取自举的样本。
- figMatplotlib.figure.图,默认为无
如果给定,它将使用 fig 用于绘图的参考,而不是使用默认参数创建新的参考。
- size整型,默认为50
每次采样期间要考虑的数据点数量。它必须小于或等于 series 。
- samples整型,默认为500
执行引导过程的次数。
- **kwds
要传递给matplotlib绘图方法的选项。
- 退货
- matplotlib.figure.Figure
Matplotlib图。
参见
DataFrame.plotDataFrame对象的基本打印。
Series.plot系列对象的基本打印。
示例
此示例绘制了一个系列的基本引导图。
>>> s = pd.Series(np.random.uniform(size=100))
>>> pd.plotting.bootstrap_plot(s)
<Figure size 640x480 with 6 Axes>