pandas.plotting.andrews_curves#
- pandas.plotting.andrews_curves(frame, class_column, ax=None, samples=200, color=None, colormap=None, **kwargs)[源代码]#
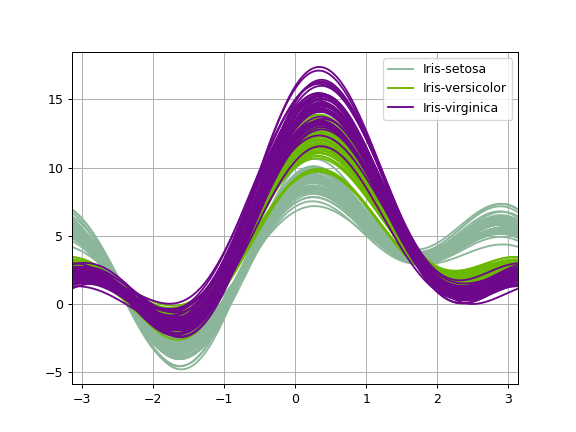
生成安德鲁斯曲线的matplotlib图,用于可视化多变量数据集群。
安德鲁斯曲线具有函数形式:
- F(T)=x_1/SQRT(2)+x_2Sin(T)+x_3cos(T)+
X_4sin(2t)+x_5cos(2t)+...
其中x系数对应于每个维度的值,并且t在-pi和+pi之间线性间隔。然后,每行帧对应于一条曲线。
- 参数
- frameDataFrame
要绘制的数据,最好归一化为(0.0,1.0)。
- class_column包含类名称的列的名称
- axMatplotlib轴对象,默认为无
- samples每条曲线中要绘制的点数
- color列表或元组,可选
用于不同类别的颜色。
- colormap字符串或matplotlib色彩映射表对象,默认为无
从中选择颜色的Colormap。如果是字符串,则从matplotlib加载具有该名称Colormap。
- **kwargs
要传递给matplotlib绘图方法的选项。
- 退货
- 类:matplotlip.axis.Axes
示例
>>> df = pd.read_csv(
...     'https://raw.github.com/pandas-dev/'
...     'pandas/main/pandas/tests/io/data/csv/iris.csv'
... )
>>> pd.plotting.andrews_curves(df, 'Name')
<AxesSubplot:title={'center':'width'}>