遥感教程第1-3页
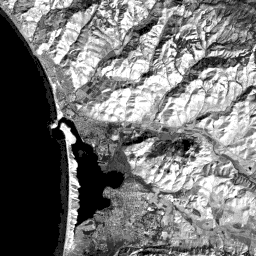
为了便于比较,本页并排显示了1984年11月获得的覆盖莫罗湾次新世的7个TM波段。还给出了每个的dn柱状图。还有一张特征图,用彩色字母(以柔和的3波段图像为基础)表示第1节中提到的一些主要地面特征。
主题地图绘制带
TM 1 |
TM 2 |
TM 3 |
TM 4 |
|
|
TM 5 |
TM 6 |
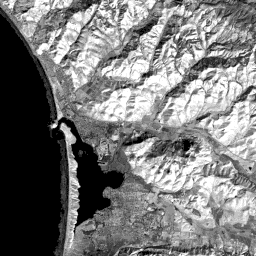
表: 不同TM波段记录的Morro Bay
TM 7
每幅图像都有自己的色调特征,以及由色调边界和图案定义的独特形状,有助于识别地面特征。您可以查看 ` <>`__histograms for each band clicking on each of the following links: histogram 1 , histogram 2 , histogram 3 , histogram 4 , histogram 5 , histogram 6 , histogram 7 . 注意,每个柱状图都是双峰的,在非常低的值(水)有一个峰值,在不同的中间dn值有第二个峰值。
特征识别图
在接下来的论文中,为了集中注意力,我们通过在背景图像上的字母来识别特定的特征和模式,在背景图像上我们将灰色调变平。看看地图 now . 您可以通过单击带下划线和彩色的字母随时链接到此地图。(要删除显示的地图,请单击屏幕右上角的X按钮。)为了方便参考,我们建议您打印此地图,如果您不希望每次在以后的页面上引用地图时都下载它,请将其保存在方便的位置。背景图像是由tm 1制成的,其中的灰度被有意收缩,以显示较小的对比度。
` <>`__1-4: As a preliminary to the more detailed feature descriptions that follow in this section, make a simple table with each of the seven TM bands running horizontally along rows and the following categories making up the vertical columns: silt in ocean water; wave breakers; beach sand on a bar; the town of Los Osos; the marshy delta; sun-facing slopes (lower right surfaces in the hilly parts of the image); shadows. In this table' boxes (draw them or imagine them) put down some representative gray level ranging from very light tone; light gray; medium gray; dark gray; blackish (your choice will be somewhat subjective). `ANSWER <Sect1_zanswer.html#1-4>`__