5. 数据捕获
|
目标: |
了解如何创建和编辑矢量和属性数据。 |
关键词: |
编辑、数据捕获、平视、表格、数据库。 |
5.1. 概述
在前两个主题中,我们研究了矢量数据。我们看到,矢量数据有两个关键概念,即: geometry 和 attributes 。矢量要素的几何描述其 shape 和 position ,而 attributes 描述其 properties (颜色、大小、年龄等)。
在本节中,我们将更仔细地了解创建和编辑矢量数据的过程-矢量要素的几何和属性。
5.2. 地理信息系统数字数据是如何存储的?
文字处理程序、电子表格和图形包都是用来创建和编辑数字数据的程序。每种类型的应用程序都将其数据保存为特定的文件格式。例如,图形程序将允许您将图形另存为 .jpg JPEG图像,文字处理器允许您将文档另存为 .odt OpenDocument或 .doc Word文档等。
就像这些其他应用程序一样,地理信息系统应用程序可以将其数据存储在计算机硬盘上的文件中。有许多不同的文件格式的地理信息系统数据,但最常见的可能是‘形状文件’。这个名称有点奇怪,因为虽然我们称它为Shape文件(单数),但它实际上至少由三个不同的文件组成,这些文件一起工作来存储数字矢量数据,如中所示 table_shapefile.
延拓 |
描述 |
|---|---|
|
矢量要素的几何存储在此文件中 |
|
矢量要素的属性存储在此文件中 |
|
此文件是一个索引,可帮助GIS应用程序更快地查找要素。 |
表Shapefile 1:共同构成“shapefile”的基本文件。
When you look at the files that make up a shapefile on the computer hard disk,
you will see something like 图 5.8. If you want to share vector data
stored in shapefiles with another person, it is important to give them all of
the files for that layer. So in the case of the trees layer shown in 图 5.8,
you would need to give the person trees.shp, trees.shx,
trees.dbf, trees.prj and trees.qml.
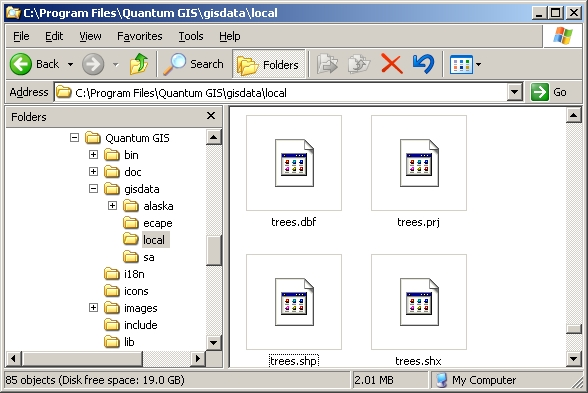
图 5.8 在计算机的文件管理器中可以看到的组成“树”形文件的文件。
许多GIS应用程序还能够将数字数据存储在 database 。通常,将GIS数据存储在数据库中是一个很好的解决方案,因为数据库可以存储 large amounts 数据的数量 efficiently 并且可以快速地向地理信息系统应用程序提供数据。使用数据库还允许许多人同时使用相同的矢量数据图层。设置数据库来存储GIS数据比使用shapefile复杂,因此在本主题中,我们将重点介绍创建和编辑shapefile。
5.3. 开始之前做好计划
在创建新的矢量层(将存储在shapefile中)之前,需要知道该层的几何图形是什么(点、多段线或多边形),并且需要知道该层的属性。让我们看几个例子,然后就会变得更清楚如何做到这一点。
5.3.1. 示例1:创建旅游地图
想象一下,您想要为您所在的地区创建一张漂亮的旅游地图。你设想的最终地图是一张1:50000的地形图,上面覆盖着游客感兴趣的景点的标记。首先,让我们来考虑一下几何图形。我们知道,我们可以使用点、折线或多边形要素来表示矢量层。哪一个对我们的旅游地图最有意义?如果我们想要标记特定的位置,如瞭望点、纪念碑、战斗地点等,我们可以使用点。如果我们想沿着一条路线带游客,比如通过山口的风景优美的路线,使用折线可能是有意义的。如果我们有整个具有旅游价值的地区,比如自然保护区或文化村,多边形可能是一个很好的选择。
As you can see it's often not easy to know what type of geometry you will need. One common approach to this problem is to make one layer for each geometry type you need. So, for example, if you look at digital data provided by the Chief Directorate: Surveys and Mapping, South Africa, they provide a river areas (polygons) layer and a rivers polyline layer. They use the river areas (polygons) to represent river stretches that are wide, and they use river polylines to represent narrow stretches of river. In 图 5.9 we can see how our tourism layers might look on a map if we used all three geometry types.
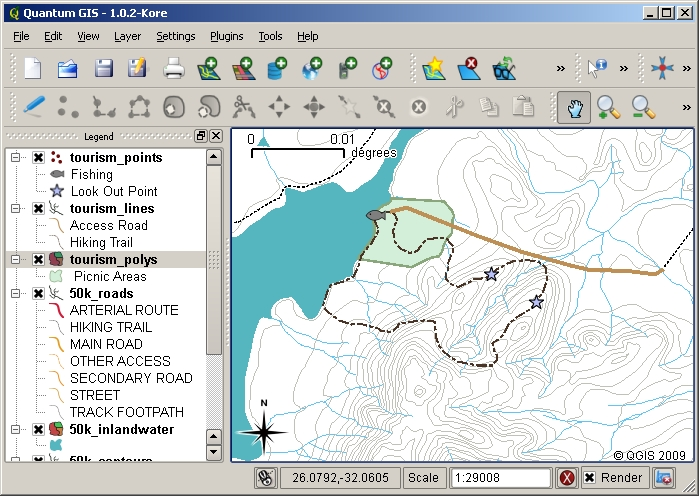
图 5.9 一张带有旅游图层的地图。我们为旅游数据使用了三种不同的几何类型,以便我们可以适当地表示游客所需的不同类型的要素,为他们提供他们需要的所有信息。
5.3.2. 示例2:创建河流沿线的污染级别地图
如果你想测量一条河流沿途的污染水平,你通常会乘船沿着河流旅行,或者沿着河岸步行。每隔一段时间,你就会停下来进行各种测量,如溶解氧(DO)水平、大肠菌群(CB)计数、浊度水平和酸碱度。您还需要对您的位置进行地图读取或使用GPS接收器获取您的位置。
要将从类似这样的练习中收集的数据存储在GIS应用程序中,您可能需要创建一个具有点几何图形的GIS图层。使用点几何体在这里是有意义的,因为每个采样都代表了一个非常特定的地方的条件。
对于我们需要的属性, field 用于描述示例站点的每一项内容。因此,我们最终可能会得到如下所示的属性表 table_river_attributes.
SampleNo |
PH值 |
DO |
CB |
浑浊度 |
收集器 |
日期 |
|---|---|---|---|---|---|---|
1 |
7 |
6 |
N |
低 |
耐性 |
12/01/2009 |
2 |
6.8 |
5 |
Y |
5~6成熟 |
塔博 |
12/01/2009 |
3 |
6.9 |
6 |
Y |
高 |
维克多 |
12/01/2009 |
表河属性1:在创建向量层之前绘制这样的表将允许您决定需要哪些属性字段(列)。请注意,几何图形(采集样本的位置)不会显示在属性表中-地理信息系统应用程序将其单独存储!
5.4. 创建空的shapefile
规划好要捕获到GIS中的要素以及每个要素应具有的几何图形类型和属性后,可以继续下一步创建空的shapefile。
The process usually starts with choosing the 'new vector layer' option in your GIS Application and then selecting a geometry type (see 图 5.10). As we covered in an earlier topic, this means choosing either point, polyline or polygon for the geometry.
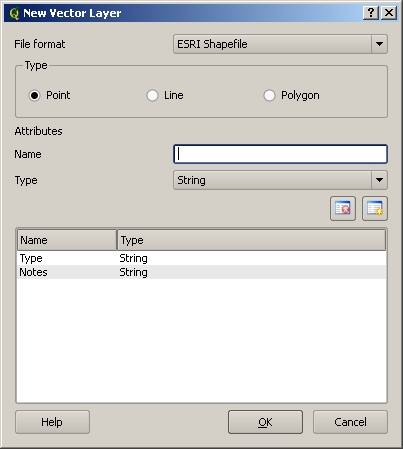
图 5.10 创建一个新的矢量层就像在表单中填写一些细节一样简单。首先选择几何体类型,然后添加属性字段。
接下来,您将向属性表中添加字段。通常,我们给出的字段名称应简短,不含空格,并指明该字段中存储的信息类型。示例字段名称可以是‘pH’、‘RoofColour’、‘RoadType’等。除了为每个字段选择名称之外,您还需要指出信息应该如何存储在该字段中-即它是一个数字、一个单词、一个句子还是一个日期?
计算机程序通常调用由单词或句子组成的信息 strings ‘,因此,如果您需要存储街道名称或河流名称之类的内容,则应使用’字符串‘作为字段类型。
Shapefile格式允许您将数值字段信息存储为一个整数( integer )或十进制数( floating point )-所以您需要事先考虑您要捕获的数字数据是否会有小数位。
The final step (as shown in 图 5.11) for creating a shapefile is to give it a name and a place on the computer hard disk where it should be created. Once again it is a good idea to give the shapefile a short and meaningful name. Good examples are 'rivers', 'watersamples' and so on.
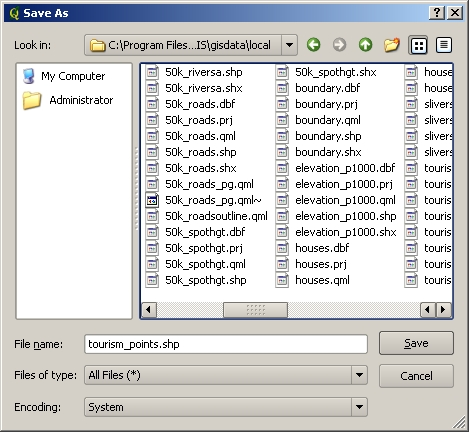
图 5.11 在定义了新层的几何图形和属性后,我们需要将其保存到磁盘。为您的shapefile指定一个简短但有意义的名称非常重要。
让我们快速回顾一下这个过程。要创建shapefile,首先要说明它将包含哪种几何图形,然后为属性表创建一个或多个字段,然后使用易于识别的名称将shapefile保存到硬盘。简单得像1-2-3!
5.5. 将数据添加到shapefile
到目前为止,我们只创建了一个空的shapefile。现在我们需要使用‘启用编辑’菜单选项或在地理信息系统应用程序中的工具栏图标在shapefile中启用编辑。默认情况下,Shapefile不能进行编辑,以防止意外更改或删除其中包含的数据。接下来,我们需要开始添加数据。对于添加到shapefile的每个记录,我们需要完成两个步骤:
捕获几何体
输入属性
捕捉几何图形的过程对于点、多段线和多边形是不同的。
To capture a point, you first use the map pan and zoom tools to get to the correct geographical area that you are going to be recording data for. Next you will need to enable the point capture tool. Having done that, the next place you click with the left mouse button in the map view, is where you want your new point geometry to appear. After you click on the map, a window will appear and you can enter all of the attribute data for that point (see 图 5.12). If you are unsure of the data for a given field you can usually leave it blank, but be aware that if you leave a lot of fields blank it will be hard to make a useful map from your data!
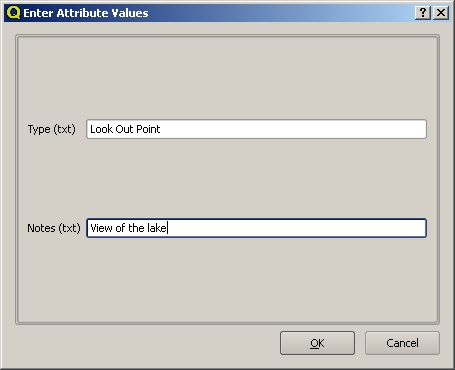
图 5.12 捕获点几何图形后,系统将要求您描述其属性。属性表单基于您在创建向量层时指定的字段。
To capture a polyline the process is similar to that of a point, in that you need to first use the pan and zoom tools to move the map in the map view to the correct geographical area. You should be zoomed in enough so that your new vector polyline feature will have an appropriate scale (see 矢量数据 for more details on scale issues). When you are ready, you can click the polyline capture icon in the tool bar and then start drawing your line by clicking on the map. After you make your first click, you will notice that the line stretches like an elastic band to follow the mouse cursor around as you move it. Each time you click with the left mouse button, a new vertex will be added to the map. This process is shown in 图 5.13.
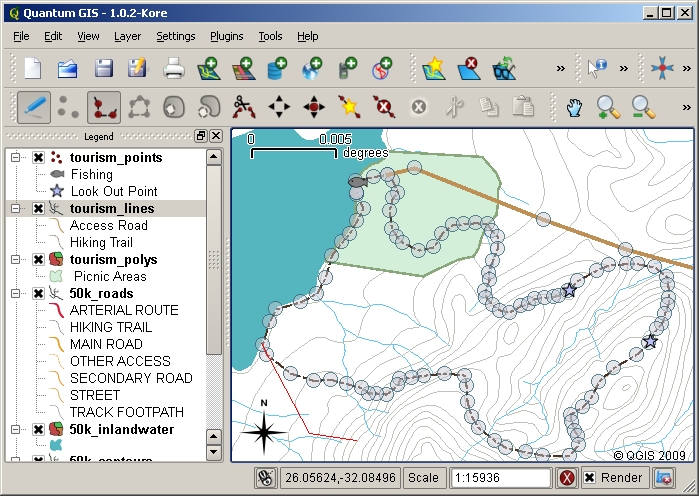
图 5.13 为旅游地图捕捉线条。编辑线层时,顶点显示为圆形标记,您可以使用鼠标移动这些标记来调整线的几何图形。当添加一条新线(以红色显示)时,每次单击鼠标都会添加一个新顶点。
定义完您的行后,使用 right mouse button 以通知GIS应用程序您已完成编辑。与捕捉点要素的过程一样,系统将要求您输入新多段线要素的属性数据。
这一过程 capturing a polygon 与捕捉多段线几乎相同,只是需要使用工具栏中的多边形捕捉工具。此外,您还会注意到,当您在屏幕上绘制几何图形时,GIS应用程序始终会创建一个封闭区域。
要在创建第一个要素后添加新要素,只需在点、折线或多边形捕捉工具处于活动状态时再次在地图上单击,然后开始绘制下一个要素。
当你没有更多的功能需要添加时,一定要点击“允许编辑”图标将其关闭。然后,地理信息系统应用程序会将新创建的层保存到硬盘。
5.6. 平视数字化
As you have probably discovered by now if you followed the steps above, it is pretty hard to draw the features so that they are spatially correct if you do not have other features that you can use as a point of reference. One common solution to this problem is to use a raster layer (such as an aerial photograph or a satellite image) as a backdrop layer. You can then use this layer as a reference map, or even trace the features off the raster layer into your vector layer if they are visible. This process is known as 'heads-up digitising' and is shown in 图 5.14.
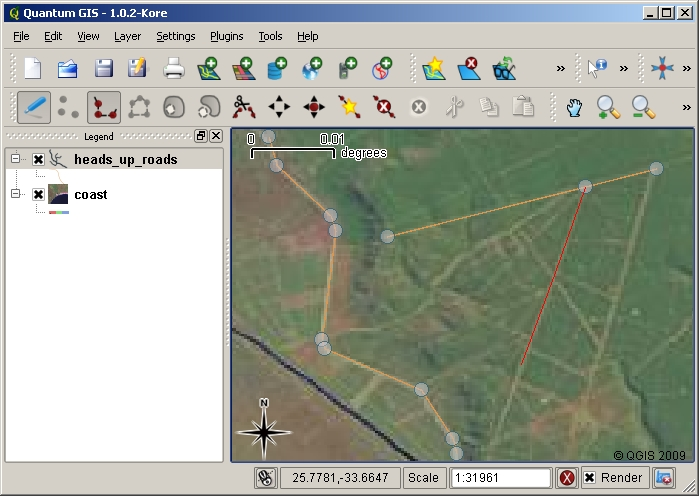
图 5.14 使用卫星图像作为背景的平视数字化。该图像用作通过跟踪多段线要素来捕获它们的参考。
5.7. 使用数字化工作台进行数字化
Another method of capturing vector data is to use a digitising table. This approach is less commonly used except by GIS professionals, and it requires expensive equipment. The process of using a digitising table, is to place a paper map on the table. The paper map is held securely in place using clips. Then a special device called a 'puck' is used to trace features from the map. Tiny cross-hairs in the puck are used to ensure that lines and points are drawn accurately. The puck is connected to a computer and each feature that is captured using the puck gets stored in the computer's memory. You can see what a digitising puck looks like in 图 5.15.
图 5.15 当地理信息系统专业人员想要从现有地图数字化要素时,他们使用数字化工作台和圆盘。
5.8. 在你的特征被数字化之后。
数字化要素后,可以使用在上一主题中学到的技术来设置图层的符号系统。选择适当的符号系统将使您在查看地图时更好地理解所捕获的数据。
5.9. 需要注意的常见问题/事情
If you are digitising using a backdrop raster layer such as an aerial photograph or satellite image, it is very important that the raster layer is properly georeferenced. A layer that is georeferenced properly displays in the correct position in the map view based on the GIS Application's internal model of the Earth. We can see the effect of a poorly georeferenced image in 图 5.16.
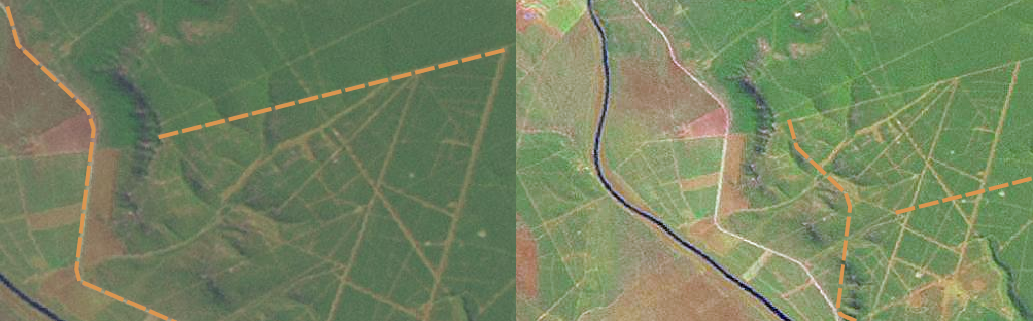
图 5.16 使用适当的地理参考栅格图像进行平视数字化的重要性。在左边,我们可以看到图像已经正确地进行了地理配准,道路要素(以橙色表示)完全重叠。如果图像的地理配准较差(如右图所示),则要素将不会很好地对齐。更糟糕的是,如果在捕获新特征时将右侧的图像用作参考,则新捕获的数据将不准确!
还要记住,放大到适当的比例很重要,这样才能使您创建的矢量要素有用。正如我们在上一个关于矢量几何的主题中所看到的那样,如果您打算在以后以1:50 000的比例使用捕获的数据,则在缩小到1:1000 000的比例时数字化数据是不好的。
5.10. 我们学到了什么?
让我们总结一下我们在此工作表中介绍的内容:
Digitising 是获取要素的知识的过程 geometry 和 attributes 变成一个 digital format 存储在计算机的磁盘上。
地理信息系统数据可以存储在 database 或作为 files 。
一种常用的文件格式是 shapefile 它实际上是一个由三个或更多文件组成的组 (
.shp,.dbf和.shx)。在创建新的矢量层之前,您需要计划 geometry 类型和 attribute 它将包含的字段。
几何图形可以是点、多段线或多边形。
属性可以是 integers (整数), floating points (十进制数)、 strings (文字)或 dates 。
数字化过程包括 drawing 地图视图中的几何体,然后输入其属性。对每个功能重复执行此操作。
Heads-up digitising 通常用于在数字化过程中通过在背景中使用栅格图像来提供方向。
专业的GIS用户有时会使用 digitising table 从纸质地图中获取信息。
5.11. 现在你来试试吧!
以下是一些建议,可供您尝试与您的学习者:
列一张清单,列出你认为有兴趣捕捉到的学校内部和周围的特征。例如:学校边界、消防集结点位置、每个教室的布局等。尝试混合使用不同的几何体类型。现在,将学员分成几组,并为每组分配几个要捕获的特征。让它们象征它们的层次,这样它们看起来更有意义。将所有组的层组合在一起,创建一张漂亮的学校及其周围环境的地图!
找一条当地的河流,沿着它的长度采集水样。使用GPS或通过在拓扑表上标记来仔细记录每个样本的位置。对每个样本进行测量,如PH值、溶解氧等。使用地理信息系统应用程序捕获数据,并制作地图,以适当的符号系统显示样本。你能找出任何令人担忧的领域吗?地理信息系统应用程序是否能够帮助您识别这些区域?
5.12. 一些值得思考的事情
如果您没有可用的计算机,您可以使用透明胶片和笔记本遵循相同的过程。使用航拍照片、正射影像或卫星图像打印输出作为背景层。在笔记本中向下拉列,并为要存储其信息的每个属性字段写下列标题。现在将要素的几何图形绘制到透明工作表上,在每个要素旁边写上一个数字,这样就可以识别它。现在在笔记本中表格的第一列中写下相同的数字,然后填写您要记录的所有其他信息。
5.13. 进一步阅读
QGIS用户指南》提供了更多有关 digitising vector data 在QGIS中。
5.14. 下一步是什么?
在接下来的部分中,我们将更仔细地了解 raster data 了解如何在地理信息系统中使用图像数据。