4. 矢量属性数据
|
目标: |
在本主题中,我们将介绍属性数据如何与矢量要素相关联并可用于符号化数据。 |
关键词: |
属性、数据库、字段、数据、矢量、符号系统 |
4.1. 概述
If every line on a map was the same colour, width, thickness, and had the same label, it would be very hard to make out what was going on. The map would also give us very little information. Take a look at 图 4.6 for example.
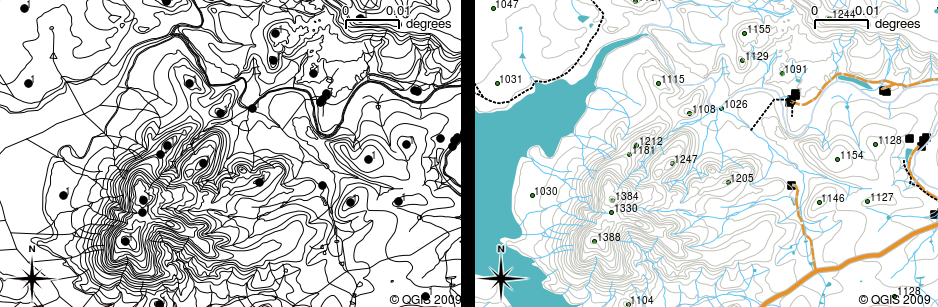
图 4.6 当颜色和不同的符号被用来帮助你区分一种类型的特征和另一种特征时,地图就变得栩栩如生。你能用左边的地图区分河流、道路和等高线吗?使用右侧的地图可以更容易地看到不同的特征。
In this topic we will look at how attribute data can help us to make interesting and informative maps. In the previous topic on vector data, we briefly explained that attribute data are used to describe vector features. Take a look at the house pictures in 图 4.7.
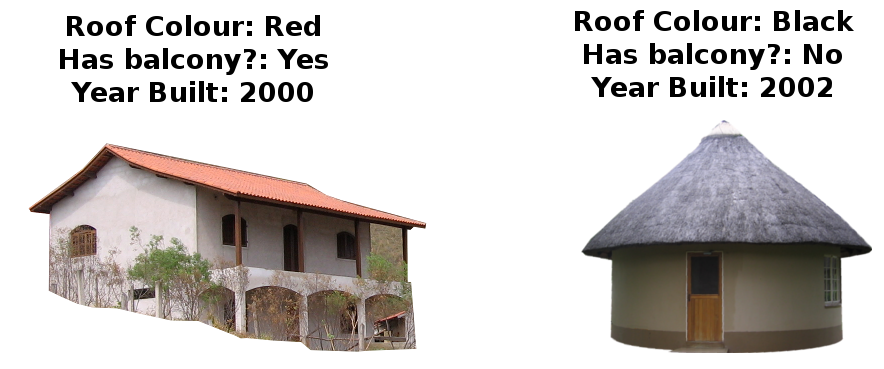
图 4.7 每个特征都有我们可以描述的特征。这些可以是可见的东西,也可以是我们知道的关于该功能的东西(例如,年代久远)。
The geometry of these house features is a polygon (based on the floor plan of the house), the attributes we have recorded are roof colour, whether there is a balcony, and the year the house was built. Note that attributes don't have to be visible things --– they can describe things we know about the feature such as the year it was built. In a GIS Application, we can represent this feature type in a houses polygon layer, and the attributes in an attribute table (see 图 4.8).
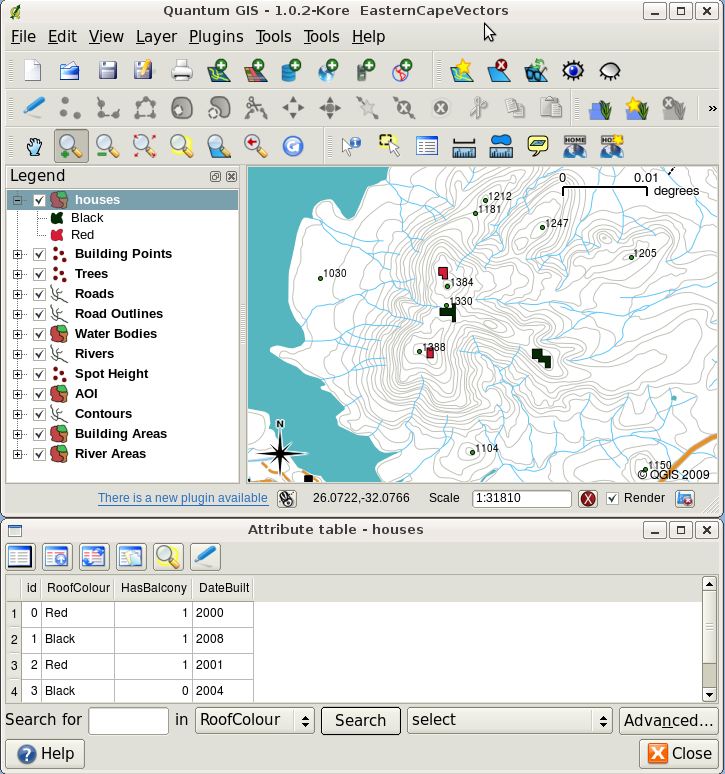
图 4.8 一层房屋。房屋特征具有描述房屋屋顶颜色和其他属性的属性。属性表(下图)列出了地图上显示的房屋区域的属性。当某个要素在表中亮显时,它将在地图上显示为黄色多边形。
The fact that features have attributes as well geometry in a GIS Application opens up many possibilities. For example we can use the attribute values to tell the GIS what colours and style to use when drawing features (see 图 4.9). The process of setting colours and drawing styles is often referred to as setting feature symbology.
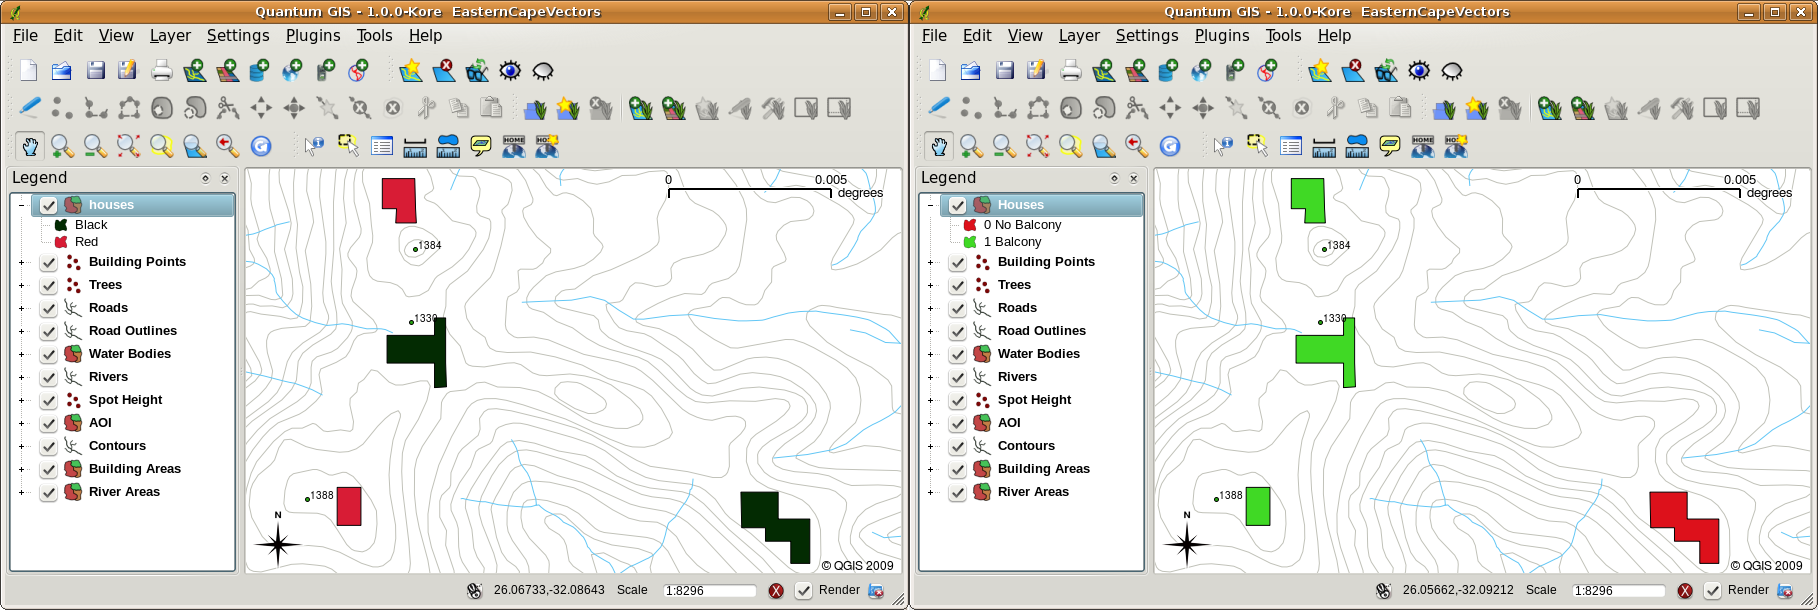
图 4.9 在GIS应用程序中,我们可以根据要素的属性以不同的方式绘制要素。在左侧,我们用与屋顶属性相同的颜色绘制了房屋多边形。在右边,我们根据房子是否有阳台来给它们上色。
属性数据在创建时也很有用 map labels 。大多数地理信息系统应用程序都具有选择属性的功能,该属性应用于标注每个要素。
If you have ever searched a map for a place name or a specific feature, you will know how time consuming it can be. Having attribute data can make searching for a specific feature quick and easy. In 图 4.10 you can see an example of an attribute search in a GIS.
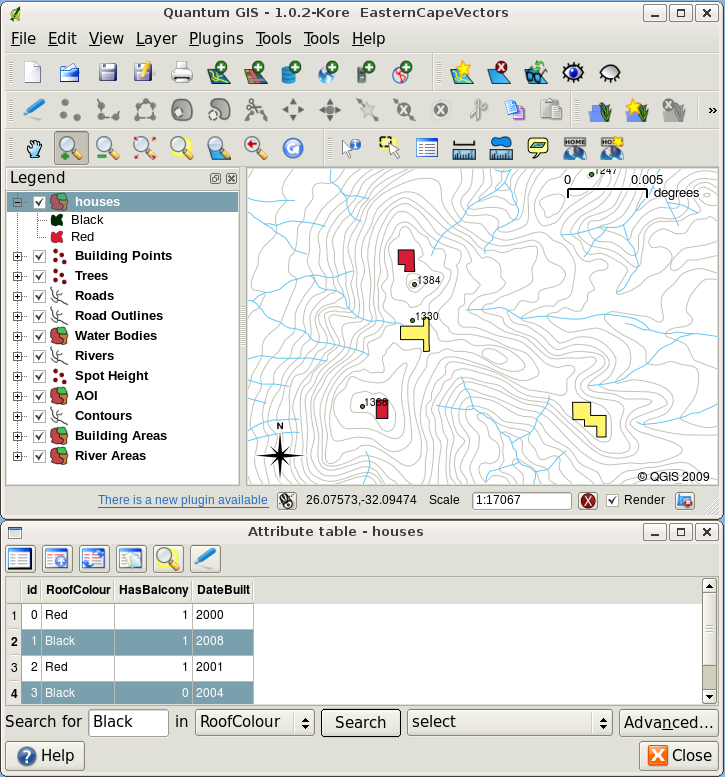
图 4.10 在GIS应用程序中,我们还可以根据要素的属性来搜索要素。在这里,我们看到的是寻找黑色屋顶的房子。结果在地图上以黄色显示,在桌子上以绿松石显示。
最后,属性数据在执行以下操作时非常有用 spatial analysis 。空间分析将存储在要素几何中的空间信息与其属性信息相结合。这使我们能够研究特征以及它们如何相互关联。有许多类型的空间分析可以执行,例如,您可以使用地理信息系统来找出在特定区域出现了多少红色屋顶房屋。如果你有树木特征,你可以使用地理信息系统来尝试找出如果一块土地被开发,哪些物种可能会受到影响。我们可以使用为河道沿线的水样存储的属性来了解污染进入溪流的位置。可能性是无限的!在后面的主题中,我们将更详细地探讨空间分析。
在我们更详细地介绍属性数据之前,让我们快速回顾一下。
Features are real world things such as roads, property boundaries, electrical substation sites and so on. A feature has a geometry (which determines if it is a point, polyline or polygon) and attributes (which describe the feature). This is shown in 图 4.11.
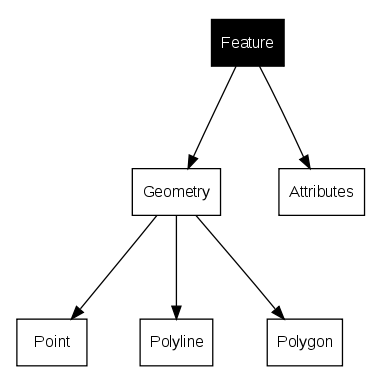
图 4.11 矢量特征一目了然。
4.2. 详细的属性
矢量要素的属性存储在 table 。表格就像电子表格。表中的每一列都称为 field 。表中的每一行都是一个 record 。表格 table_house_attributes 显示了属性表在GIS中的外观的简单样例。地理信息系统中属性表中的记录分别对应于一个要素。通常,属性表中的信息存储在某种数据库中。GIS应用程序将属性记录与要素几何相链接,以便您可以通过选择地图上的要素来查找表中的记录,并通过选择表中的要素来查找地图上的要素。
属性表 |
领域1:年鉴 |
领域2:屋顶颜色 |
领域3:阳台 |
|---|---|---|---|
记录1 |
1998 |
红色 |
是 |
记录2 |
2000 |
黑色 |
不是 |
记录3 |
2001 |
白银 |
是 |
表屋属性:属性表具有字段(列)和记录(以行为单位)。
属性表中的每个字段都包含特定类型的数据-文本、数字或日期。决定将哪些属性用于功能需要经过深思熟虑和规划。在本主题前面的房屋示例中,我们选择了屋顶颜色、阳台的存在和施工月份作为感兴趣的属性。我们也可以很容易地选择房子的其他方面,比如:
级别数
房间数
占用人数
居住类型(RDP住宅、公寓楼、棚屋、砖房等)
这座房子是在哪年建造的
房屋的建筑面积
诸如此类……
有这么多选项,我们如何正确选择一个功能需要哪些属性?它通常归结为您计划如何处理数据。如果你想要制作一个彩色编码地图来显示房屋的年限,那么为你的要素设置一个“建成年限”属性是很有意义的。如果您确定永远不会使用这种类型的地图,最好不要存储这些信息。收集和存储不需要的信息不是一个好主意,因为研究和捕获这些信息需要成本和时间。我们经常从公司、朋友或政府那里获得矢量数据。在这些情况下,通常不可能请求特定的属性,我们只能凑合着使用我们得到的。
4.3. 单个符号
如果在不使用任何属性表数据的情况下符号化要素,则只能以简单的方式绘制该要素。例如,对于点要素,您可以设置颜色和 marker (圆形、正方形、星形等)但仅此而已。您不能告诉GIS根据其在属性表中的特性之一来绘制要素。要做到这一点,需要使用 graduated , continuous 或 unique value 象征。这些将在接下来的部分中详细描述。
A GIS application will normally allow you to set the symbology of a layer using a dialog box such as the one shown in in 图 4.12. In this dialog box you can choose colours and symbol styles. Depending on the geometry type of a layer, different options may be shown. For example with point layers you can choose a marker style. With line and polygon layers there is no marker style option, but instead you can select a line style and colour such as dashed orange for gravel roads, solid orange for minor roads, and so on (as shown in 图 4.13). With polygon layers you also have the option of setting a fill style and color.
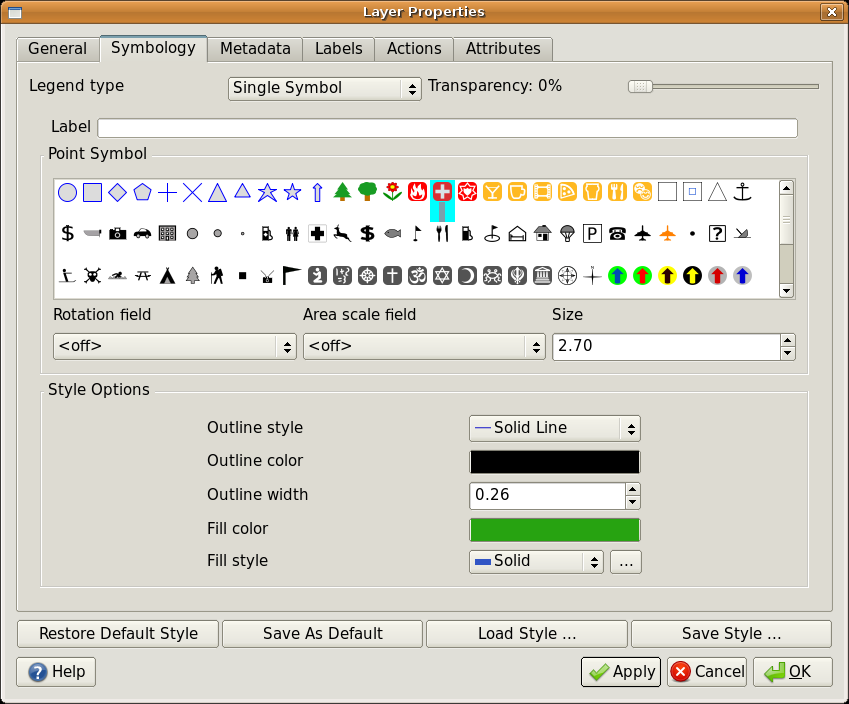
图 4.12 使用简单符号时,绘制要素时不使用属性来控制其外观。这是点要素的对话框。
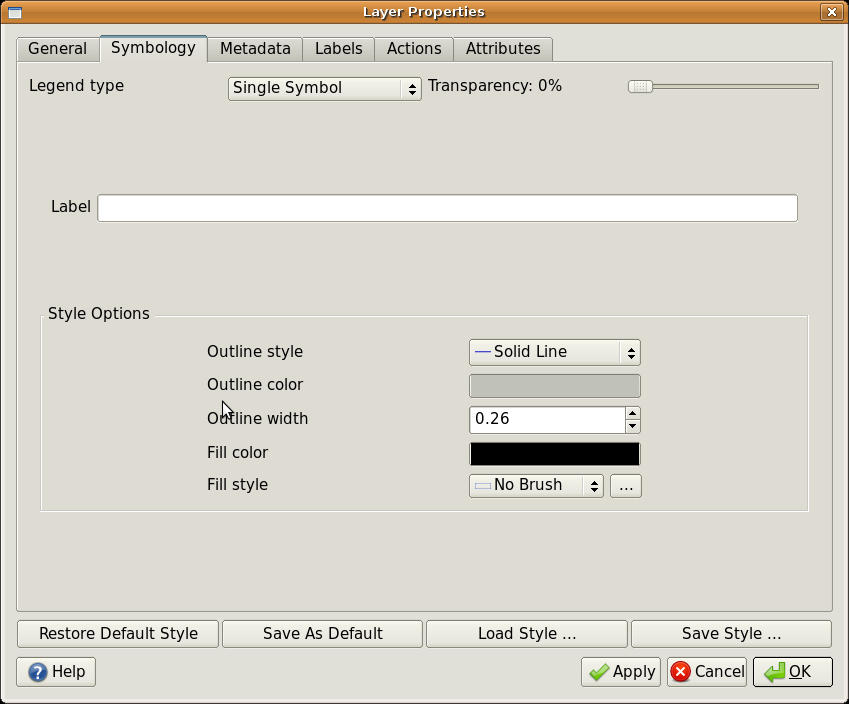
图 4.13 为多段线和多边形要素定义简单符号时,有不同的选项。
4.4. 刻度符号
有时,向量特征用不断变化的数值表示事物。轮廓线就是一个很好的例子。每条轮廓线通常都有一个称为“Height”的属性值,该属性值包含有关该轮廓线代表的高度的信息。在本主题前面的部分中,我们展示了所有用相同颜色绘制的等高线。给轮廓线添加颜色可以帮助我们解释轮廓线的含义。例如,我们可以用一种颜色绘制低洼区域,用另一种颜色绘制中等海拔区域,用第三种颜色绘制高海拔区域。
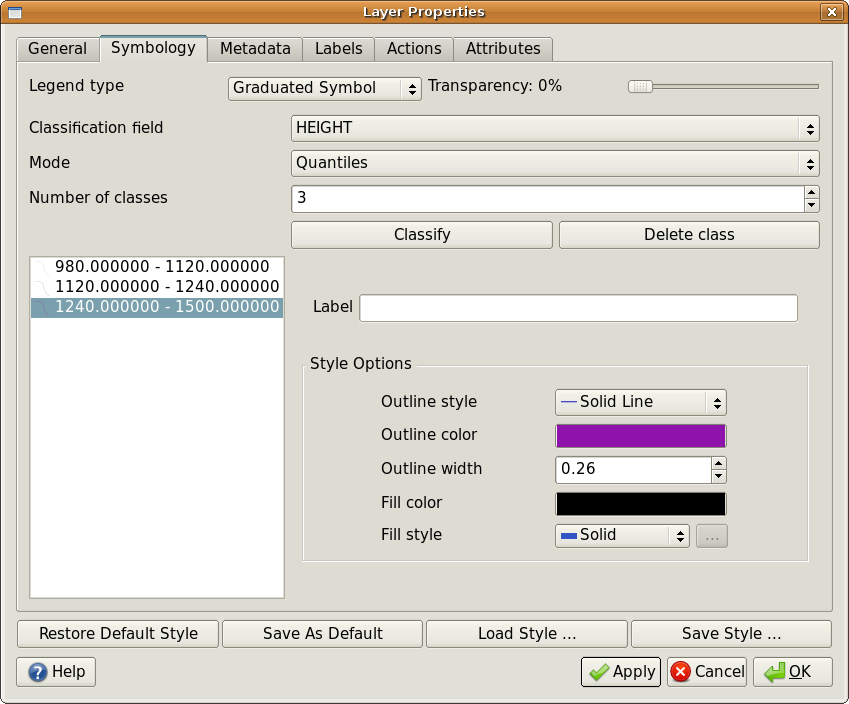
图 4.14 轮廓的高度属性可用于将轮廓划分为3类。980米至1120米之间的等高线将以棕色绘制,1120米至1240米之间的等高线将以绿色绘制,而1240米至1500米之间的等高线将以紫色绘制。
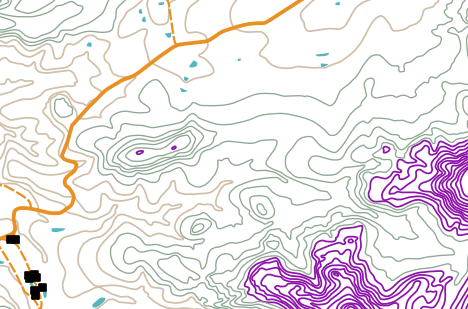
图 4.15 在为我们的等高线设置渐变颜色之后,我们的地图。
Setting colours based on discrete groups of attribute values is called Graduated Symbology in QGIS. The process is shown in Illustrations 图 4.14 and 图 4.15. Graduated symbols are most useful when you want to show clear differences between features with attribute values in different value ranges. The GIS Application will analyse the attribute data (e.g. height) and, based on the number of classes you request, create groupings for you. This process is illustrated in table_graduated.
属性值 |
阶级和色彩 |
|---|---|
1 |
第1类 |
2 |
第1类 |
3 |
第1类 |
4 |
第2类 |
5 |
第2类 |
6 |
第2类 |
7 |
第3班 |
8 |
第3班 |
9 |
第3班 |
表分级:分级颜色将属性值范围分解为您选择的班数。每一类都用不同的颜色表示。
4.5. 连续颜色符号
在关于分级颜色符号的上一节中,我们看到我们可以在离散的组或类中绘制要素。有时,在 colour range 从一种颜色到另一种颜色。地理信息系统应用程序将使用某个要素的数值属性值(例如,河流中的等高线高度或污染水平)来决定使用哪种颜色。表格 table_continuous 显示如何使用属性值来定义连续的颜色范围。
属性值 |
颜色(无类别或分组) |
|---|---|
1 |
|
2 |
|
3 |
|
4 |
|
5 |
|
6 |
|
7 |
|
8 |
|
9 |
表连续:连续颜色符号使用起始色(例如此处显示的淡橙色)和结束颜色(例如此处显示的深棕色),并在这些颜色之间创建一系列深浅不一的色调。
Using the same contours example we used in the previous section, let's see how a map with continuous colour symbology is defined and looks. The process starts by setting the layers properties to continuous colour using a dialog like the one shown in 图 4.16.
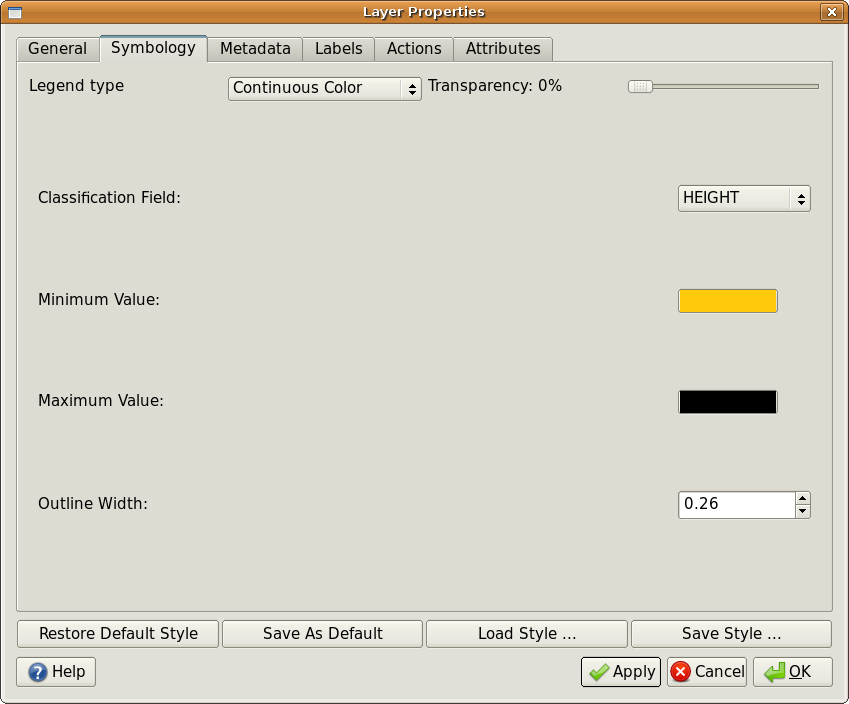
图 4.16 设置连续的颜色符号系统。轮廓高度属性用于确定颜色值。颜色是为最小值和最大值定义的。然后,地理信息系统应用程序将创建一种颜色渐变,用于根据高度绘制要素。
After defining the minimum and maximum colours in the colour range, the colour features are drawn in will depend on where the attribute lies in the range between minimum and maximum. For example if you have contour features with values starting at 1000 m and ending at 1400 m, the value range is 1000 to 1400. If the colour set for the minimum value is set to orange and the colour for the maximum value is black, contours with a value of close to 1400 m will be drawn close to black. On the other hand contours with a value near to 1000 m will be drawn close to orange (see 图 4.17).
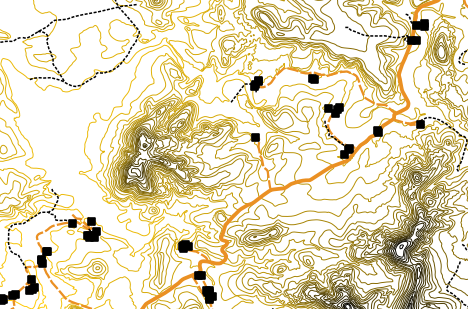
图 4.17 使用连续颜色符号绘制的等高线地图
4.6. 唯一的价值符号
有时,要素的属性不是数字,而是 strings 都被使用过。“字符串”是一个计算机术语,意思是一组字母、数字和其他书写符号。字符串属性通常用于按名称对事物进行分类。我们可以告诉GIS应用程序为每个唯一的字符串或数字赋予自己的颜色和符号。道路要素可能有不同的类别(例如“街道”、“次要道路”、“主干道”等),每个类别都以不同的颜色或符号在地理信息系统的地图视图中绘制。这一点在 table_unique.
属性值 |
颜色等级和符号 |
|---|---|
主干道 |
|
主干道 |
|
次要道路 |
|
街道 |
表唯一:要素类型(例如道路)的唯一属性值可以各自具有自己的符号。
Within the GIS Application we can open/choose to use Unique Value symbology for a layer. The GIS will scan through all the different string values in the attribute field and build a list of unique strings or numbers. Each unique value can then be assigned a colour and style. This is shown in 图 4.18.
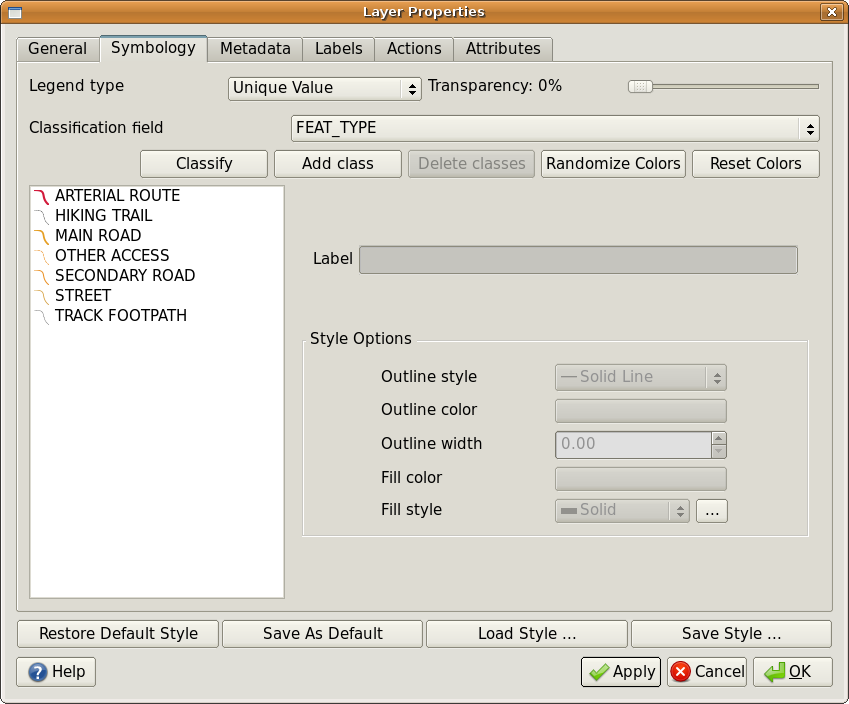
图 4.18 根据道路类型为道路定义唯一的值符号系统。
When the GIS draws the layer, it will look at the attributes of each feature before drawing it to the screen. Based on the value in the chosen field in the attribute table, the road line will be drawn with suitable colour and line style (and fill style if its a polygon feature). This is shown in 图 4.19.
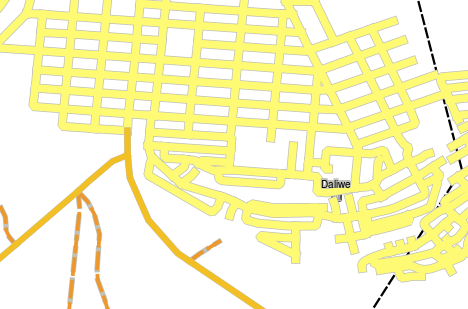
图 4.19 使用每个道路类型的唯一值进行符号化的道路矢量图层。
4.7. 需要注意的事项
决定使用哪些属性和符号需要一些规划。在你开始收集任何 GeoSpatial 数据,您应该确保您知道需要哪些属性以及如何对其进行符号化。如果你第一次计划得很糟糕,就很难回去重新收集数据。还要记住,收集属性数据的目标是允许您分析和解释空间信息。如何做到这一点取决于你试图回答的问题。符号系统是一种可视化语言,允许人们根据您使用的颜色和符号来查看和理解您的属性数据。正因为如此,你应该花很多心思在如何符号你的地图,以使他们易于理解。
4.8. 我们学到了什么?
让我们总结一下我们在此工作表中介绍的内容:
矢量要素具有 attributes
属性 describe 这个 properties 该功能的
属性存储在 table
表中的行称为 records
的确有 one record per feature 在矢量层中
表中的列称为 fields
字段表示 properties 特征,例如高度、屋顶颜色等。
字段可以包含 numerical , string (任何文本)和 date 信息
要素的属性数据可用于确定该要素的 symbolised
Graduated colour 符号系统将数据分组为离散类
Continuous colour 符号系统根据要素的属性将颜色范围内的颜色分配给要素
Unique value 符号系统将所选属性列中的每个不同值与不同的符号(颜色和样式)相关联
如果不使用矢量图层的属性来确定其符号系统,则使用 single symbol 仅限
4.9. 现在你来试试吧!
以下是一些建议,可供您尝试与您的学习者:
使用您在上一个主题中创建的表,为要用于每个要素类型的符号系统类型添加新列,并让学员确定他们将使用哪种符号系统类型(请参阅 table_example_symbols 例如)。
尝试确定将哪些符号系统类型用于以下类型的矢量要素:
显示学校周围土壤样本PH值水平的点数
显示城市道路网络的线条
房屋的多边形,其属性显示房屋是由砖头、木材还是其他材质建造的。
真实世界特征 |
几何图形类型 |
符号系统类型 |
|---|---|---|
学校的旗杆 |
点 |
单个符号 |
足球场 |
多边形 |
单个符号 |
学校内外的人行道 |
多段线 |
让学员在开学前一小时内清点每条人行道的学员人数,然后使用 graduated symbols 以显示每条人行道的人气 |
水龙头所在的地方 |
点 |
单个符号 |
课室 |
多边形 |
Unique value 根据学生在课堂上的成绩 |
篱笆 |
多段线 |
让学生对学校周围围栏的状况进行评级,方法是将围栏分成几个部分,并根据每一部分的情况按1-9的比例对每一部分进行评级。使用 graduated symbols 对条件属性进行分类。 |
课室 |
多边形 |
计算每个教室的学习者人数,并使用 continuous colour symbol 以定义从红色到蓝色的一系列颜色。 |
表示例符号:定义要素类型和要用于每种要素的符号系统类型的表示例。
4.10. 一些值得思考的事情
如果您没有可用的计算机,可以使用透明度图纸和1:50 000地图图纸来试验不同的符号类型。例如,在地图上放一张透明纸,用不同颜色的Koki笔,用红色绘制900米以下(或类似)的所有等高线,用绿色绘制900米以上或等于900米的所有线。你能想到如何用同样的技术再现其他符号类型吗?
4.11. 进一步阅读
Website: https://en.wikipedia.org/wiki/Cartography
《QGIS用户手册》还提供了有关在QGIS中使用属性数据和符号系统的更多详细信息。
4.12. 下一步是什么?
在接下来的部分中,我们将更仔细地了解 data capture. 我们将通过创建新数据来将我们所学到的关于矢量数据和属性的知识付诸实践。