9.2. 姿态估计
9.2.1. 目标
9.2.2. 基础
这将是一个小部分。在最后一次摄像机校准过程中,你已经找到了摄像机矩阵、畸变系数等。给定一个模式图像,我们可以利用上述信息来计算它的姿态,或者物体在空间中的位置,比如它是如何旋转的,它是如何移位的等等。对于一个平面物体,我们可以假设Z=0,这样,现在的问题是变成相机如何放置在空间中以查看我们的模式图像。因此,如果我们知道物体在空间中的位置,我们可以在其中绘制一些二维图来模拟三维效果。让我们看看怎么做。
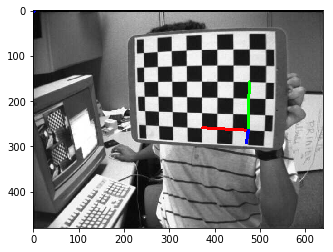
我们的问题是,我们想在棋盘的第一个角上画出我们的三维坐标轴(X,Y,Z轴)。X轴为蓝色,Y轴为绿色,Z轴为红色。所以实际上,Z轴应该感觉它垂直于棋盘平面。
首先,让我们从先前的校准结果加载相机矩阵和失真系数。
>>> import cv2
>>> import numpy as np
>>> import glob
>>>
>>> # Load previously saved data
>>> with np.load('/tmp/x_B.npz') as X:
>>>     mtx, dist, _, _ = [X[i] for i in ('mtx','dist','rvecs','tvecs')]
现在让我们创建一个函数, draw 在棋盘上取角(使用 cv2.findChessboardCorners()) ) 轴点 绘制三维轴。
>>> def draw(img, corners, imgpts):
>>>     corner = tuple(corners[0].ravel())
>>>     img = cv2.line(img, corner, tuple(imgpts[0].ravel()), (255,0,0), 5)
>>>     img = cv2.line(img, corner, tuple(imgpts[1].ravel()), (0,255,0), 5)
>>>     img = cv2.line(img, corner, tuple(imgpts[2].ravel()), (0,0,255), 5)
>>>     return img
然后和前面的例子一样,我们创建终止条件、对象点(棋盘中角的三维点)和轴点。轴点是三维空间中用于绘制轴的点。我们画出长度为3的轴(单位是象棋方格大小,因为我们是根据这个大小校准的)。我们的X轴是从(0,0,0)到(3,0,0)的,Y轴也是。对于Z轴,它从(0,0,0)绘制到(0,0,-3)。负数表示它被吸引到相机。
>>> criteria = (cv2.TERM_CRITERIA_EPS + cv2.TERM_CRITERIA_MAX_ITER, 30, 0.001)
>>> objp = np.zeros((6*7,3), np.float32)
>>> objp[:,:2] = np.mgrid[0:7,0:6].T.reshape(-1,2)
>>>
>>> axis = np.float32([[3,0,0], [0,3,0], [0,0,-3]]).reshape(-1,3)
现在,像往常一样,我们加载每个图像。搜索7x6网格。如果找到,我们用亚像素来细化它。然后计算旋转和平移,我们使用函数, cv2.solvePnPRansac() . 一旦我们得到了转换矩阵,我们就用它们来投影 轴点 到图像平面。简单地说,我们在三维空间中找到与(3,0,0),(0,3,0),(0,0,3)对应的图像平面上的点。一旦我们得到它们,我们就使用 draw() 功能。完成!!!
>>> %matplotlib inline
>>> import matplotlib.pyplot as plt
>>> import os
>>> os.chdir('/cvdata/'        )
>>> cv = cv2
>>> for fname in glob.glob('left*.jpg'):
>>>     img = cv.imread(fname)
>>>     gray = cv.cvtColor(img,cv.COLOR_BGR2GRAY)
>>>     ret, corners = cv.findChessboardCorners(gray, (7,6),None)
>>>     if ret == True:
>>>         corners2 = cv.cornerSubPix(gray,corners,(11,11),(-1,-1),criteria)
>>>         # Find the rotation and translation vectors.
>>>         ret,rvecs, tvecs = cv.solvePnP(objp, corners2, mtx, dist)
>>>         # project 3D points to image plane
>>>         imgpts, jac = cv.projectPoints(axis, rvecs, tvecs, mtx, dist)
>>>         img = draw(img,corners2,imgpts)
>>>         plt.imshow(img)
>>> #         cv.imshow('img',img)
>>> #         k = cv.waitKey(0) & 0xFF
>>> #         if k == ord('s'):
>>> #             cv.imwrite(fname[:6]+'.png', img)
>>> # cv.destroyAllWindows()

>>>
>>> for fname in glob.glob('left*.jpg'):
>>>     img = cv2.imread(fname)
>>>     gray = cv2.cvtColor(img,cv2.COLOR_BGR2GRAY)
>>>     ret, corners = cv2.findChessboardCorners(gray, (7,6),None)
>>>
>>>     if ret == True:
>>>         corners2 = cv2.cornerSubPix(gray,corners,(11,11),(-1,-1),criteria)
>>>
>>>         # Find the rotation and translation vectors.
>>>         rvecs, tvecs, inliers = cv2.solvePnPRansac(objp, corners2, mtx, dist)
>>>
>>>         # project 3D points to image plane
>>>         imgpts, jac = cv2.projectPoints(axis, rvecs, tvecs, mtx, dist)
>>>
>>>         img = draw(img,corners2,imgpts)
>>>         plt.show(img)
>>>
>>> #         cv2.imshow('img',img)
>>> #         k = cv2.waitKey(0) & 0xff
>>> #         if k == 's':
>>> #             cv2.imwrite(fname[:6]+'.png', img)
>>>
>>> # cv2.destroyAllWindows()
---------------------------------------------------------------------------

ValueError                                Traceback (most recent call last)

<ipython-input-6-ad80b9b47eba> in <module>()
     11
     12         # Find the rotation and translation vectors.
---> 13         rvecs, tvecs, inliers = cv2.solvePnPRansac(objp, corners2, mtx, dist)
     14
     15         # project 3D points to image plane


ValueError: too many values to unpack (expected 3)
请看下面的一些结果。注意,每个轴都有3个正方形长
渲染立方体
如果要绘制立方体,请修改draw()函数和轴点,如下所示。
修改的draw()函数:
>>> def draw(img, corners, imgpts):
>>>     imgpts = np.int32(imgpts).reshape(-1,2)
>>>
>>>     # draw ground floor in green
>>>     img = cv2.drawContours(img, [imgpts[:4]],-1,(0,255,0),-3)
>>>
>>>     # draw pillars in blue color
>>>     for i,j in zip(range(4),range(4,8)):
>>>         img = cv2.line(img, tuple(imgpts[i]), tuple(imgpts[j]),(255),3)
>>>
>>>     # draw top layer in red color
>>>     img = cv2.drawContours(img, [imgpts[4:]],-1,(0,0,255),3)
>>>
>>>     return img
修改轴点。它们是三维空间中立方体的8个角:
>>> axis = np.float32([[0,0,0], [0,3,0], [3,3,0], [3,0,0],
>>>                    [0,0,-3],[0,3,-3],[3,3,-3],[3,0,-3] ])
>>> tt = draw(img,corners2, axis)
>>> plt.imshow(tt)
<matplotlib.image.AxesImage at 0x7fce704fe1d0>
看看下面的结果:
如果您对图形、增强现实等感兴趣,可以使用OpenGL来渲染更复杂的图形。