作图
栅格将栅格数据读取到numpy数组中,因此可以直接使用 pyplot .
>>> import rasterio
>>> from matplotlib import pyplot
>>> src = rasterio.open("tests/data/RGB.byte.tif")
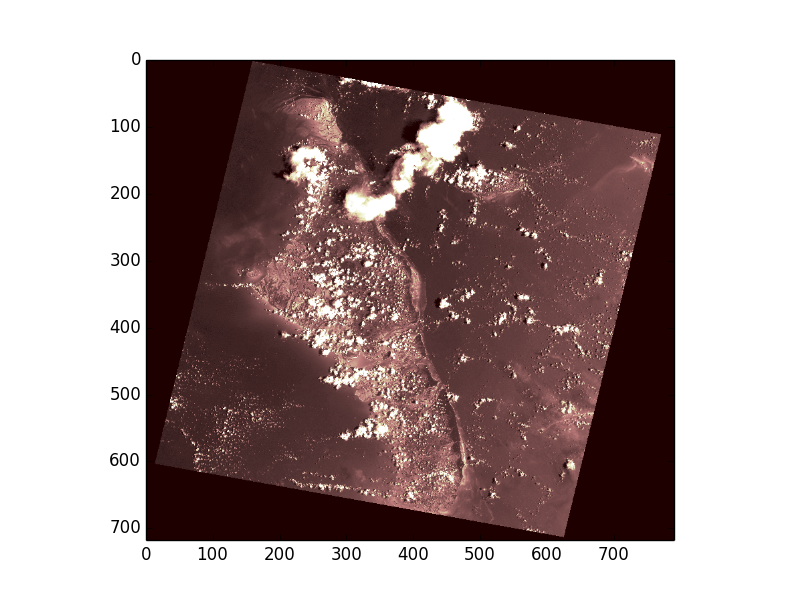
>>> pyplot.imshow(src.read(1), cmap='pink')
<matplotlib.image.AxesImage object at 0x...>
>>> pyplot.show()
栅格还提供 rasterio.plot.show 执行常见任务,例如将多波段图像显示为RGB,并用适当的地理参考范围标记轴。
第一个论点 show 表示要绘制的数据源。这可能是
以“r”模式打开的数据集对象
源的单波段,用
(src, band_index)元组一个numpy ndarray、2d或3d。如果数组是3d,请确保它是按栅格波段顺序排列的。
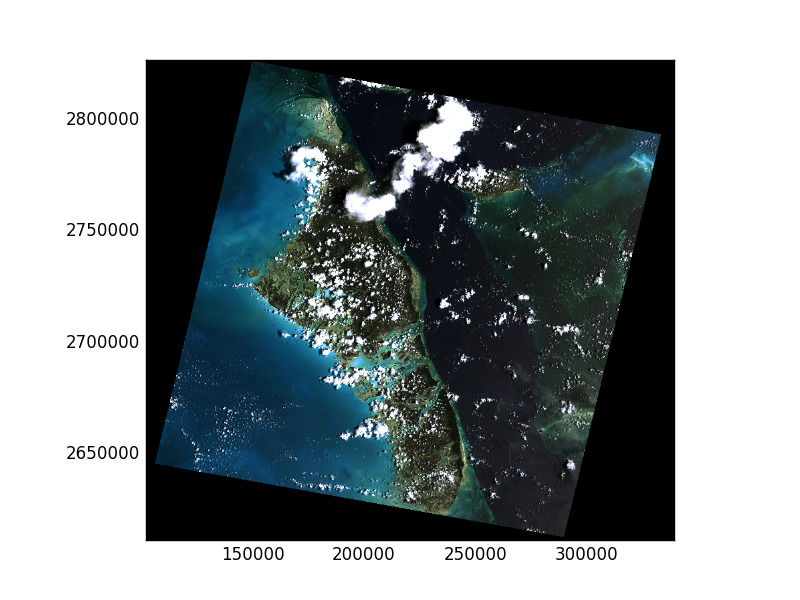
因此,以下3波段RGB数据的操作是等效的。请注意,当传递数组时,可以传递一个转换以获取范围标签。
>>> from rasterio.plot import show
>>> show(src)
<matplotlib.axes._subplots.AxesSubplot object at 0x...>
>>> show(src.read(), transform=src.transform)
<matplotlib.axes._subplots.AxesSubplot object at 0x...>
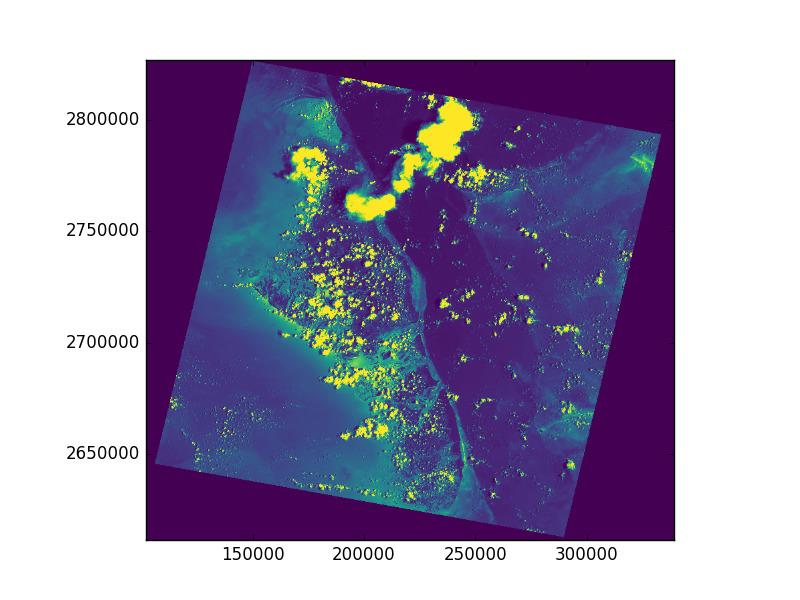
同样,对于单波段图。注意,你可以通过 cmap 指定matplotlib颜色渐变。任何关卡都传给 show 将传递给基础Pyplot函数。
>>> show((src, 2), cmap='viridis')
<matplotlib.axes._subplots.AxesSubplot object at 0x...>
>>> show(src.read(2), transform=src.transform, cmap='viridis')
<matplotlib.axes._subplots.AxesSubplot object at 0x...>
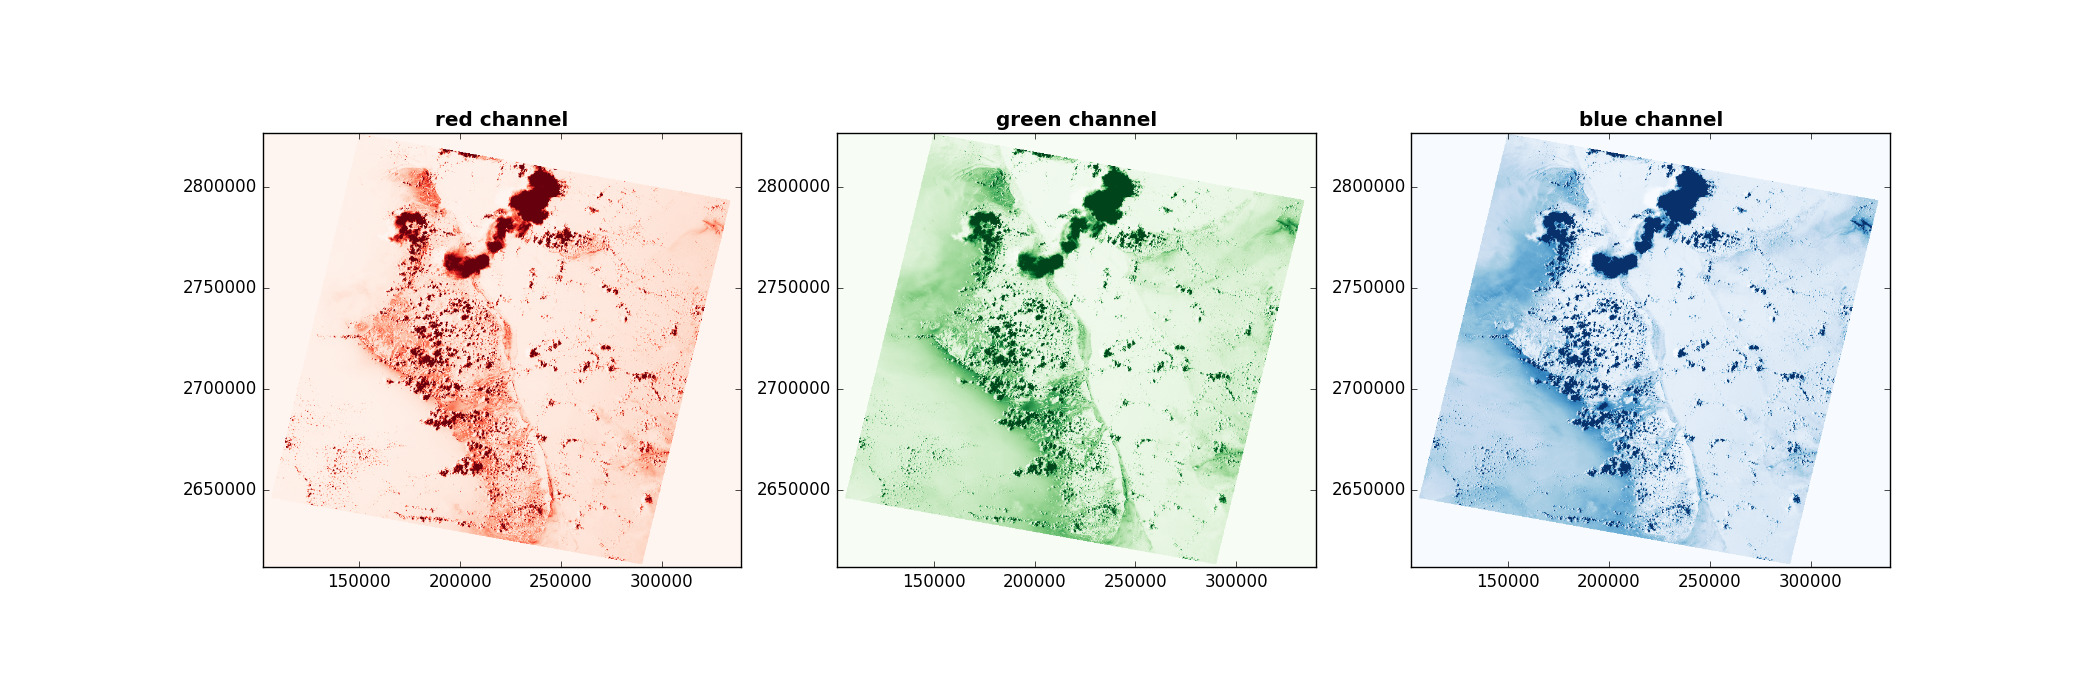
通过传递 show(..., ax=ax1) 参数。还要注意,这个例子演示了如何设置整体图形大小,并为每个子批次设置标题。
>>> fig, (axr, axg, axb) = pyplot.subplots(1,3, figsize=(21,7))
>>> show((src, 1), ax=axr, cmap='Reds', title='red channel')
<matplotlib.axes._subplots.AxesSubplot object at 0x...>
>>> show((src, 2), ax=axg, cmap='Greens', title='green channel')
<matplotlib.axes._subplots.AxesSubplot object at 0x...>
>>> show((src, 3), ax=axb, cmap='Blues', title='blue channel')
<matplotlib.axes._subplots.AxesSubplot object at 0x...>
>>> pyplot.show()
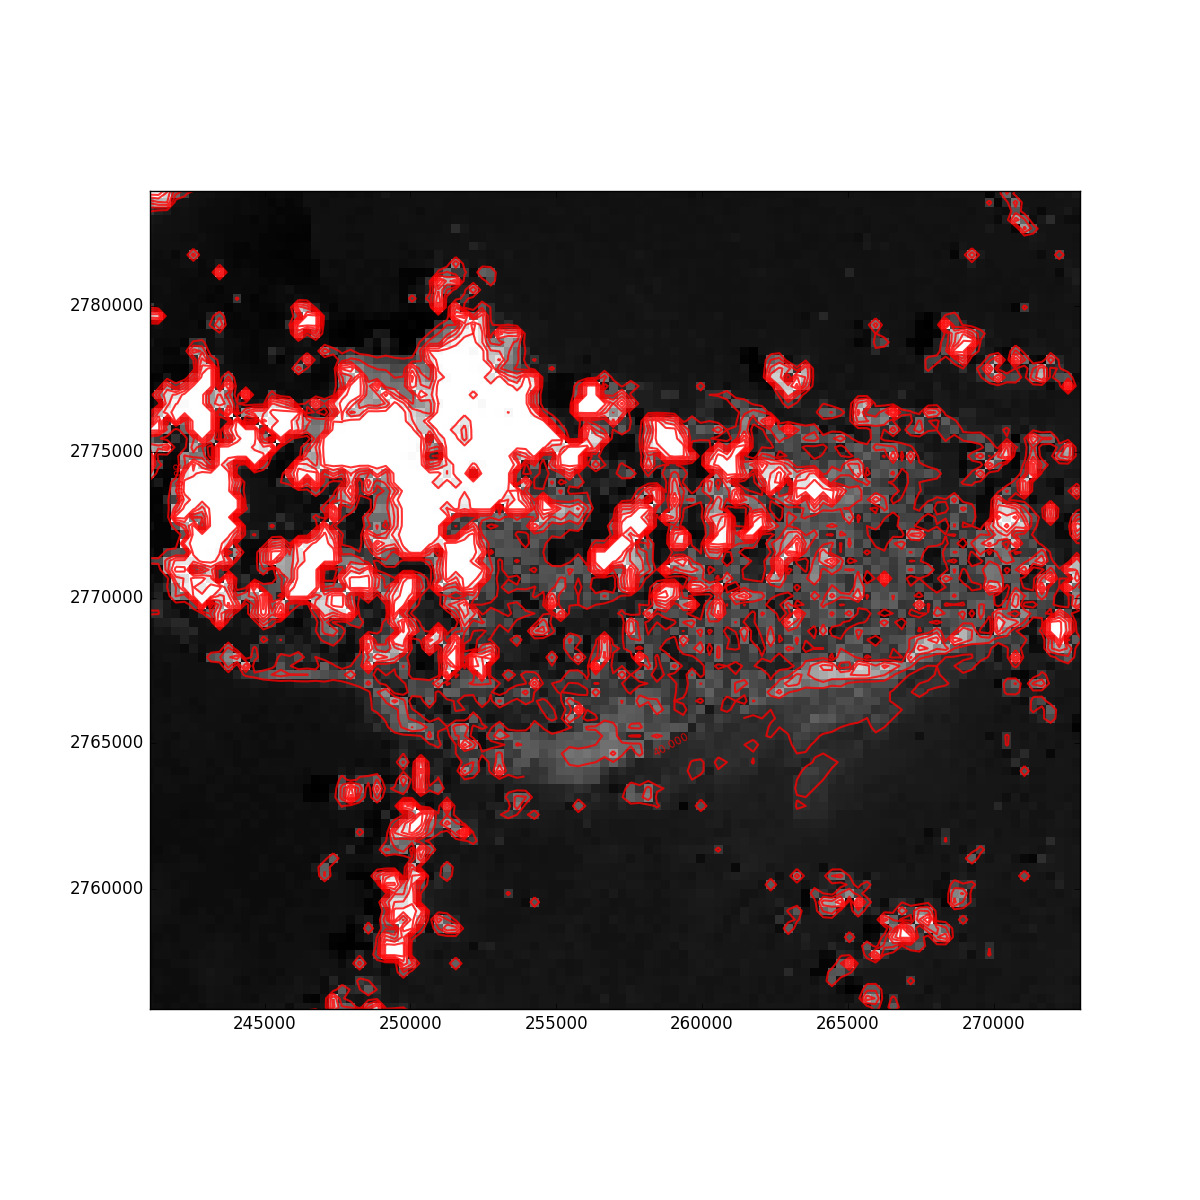
对于单波段栅格,还可以选择生成轮廓。
>>> fig, ax = pyplot.subplots(1, figsize=(12, 12))
>>> show((src, 1), cmap='Greys_r', interpolation='none', ax=ax)
<matplotlib.axes._subplots.AxesSubplot object at 0x...>
>>> show((src, 1), contour=True, ax=ax)
<matplotlib.axes._subplots.AxesSubplot object at 0x...>
>>> pyplot.show()
栅格还提供 plot.show_hist 用于生成单波段或多波段栅格柱状图的函数:
>>> from rasterio.plot import show_hist
>>> show_hist(
...     src, bins=50, lw=0.0, stacked=False, alpha=0.3,
...     histtype='stepfilled', title="Histogram")
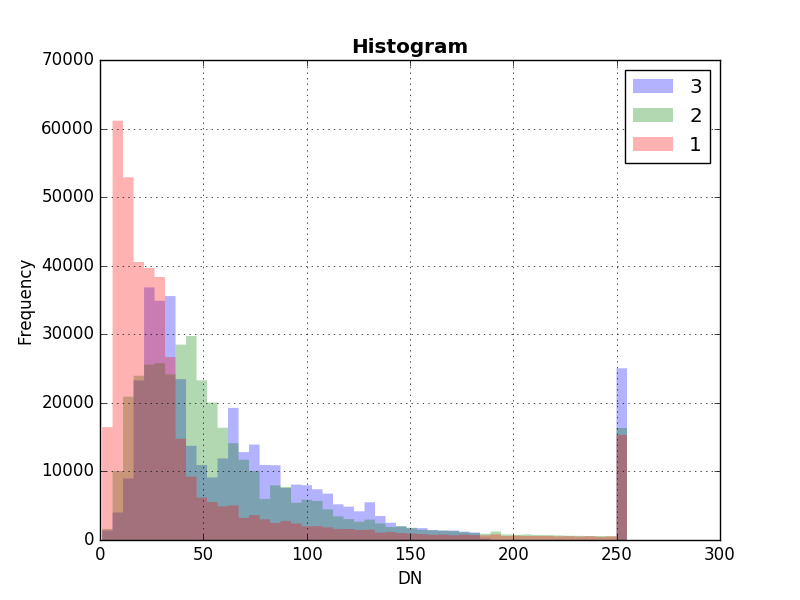
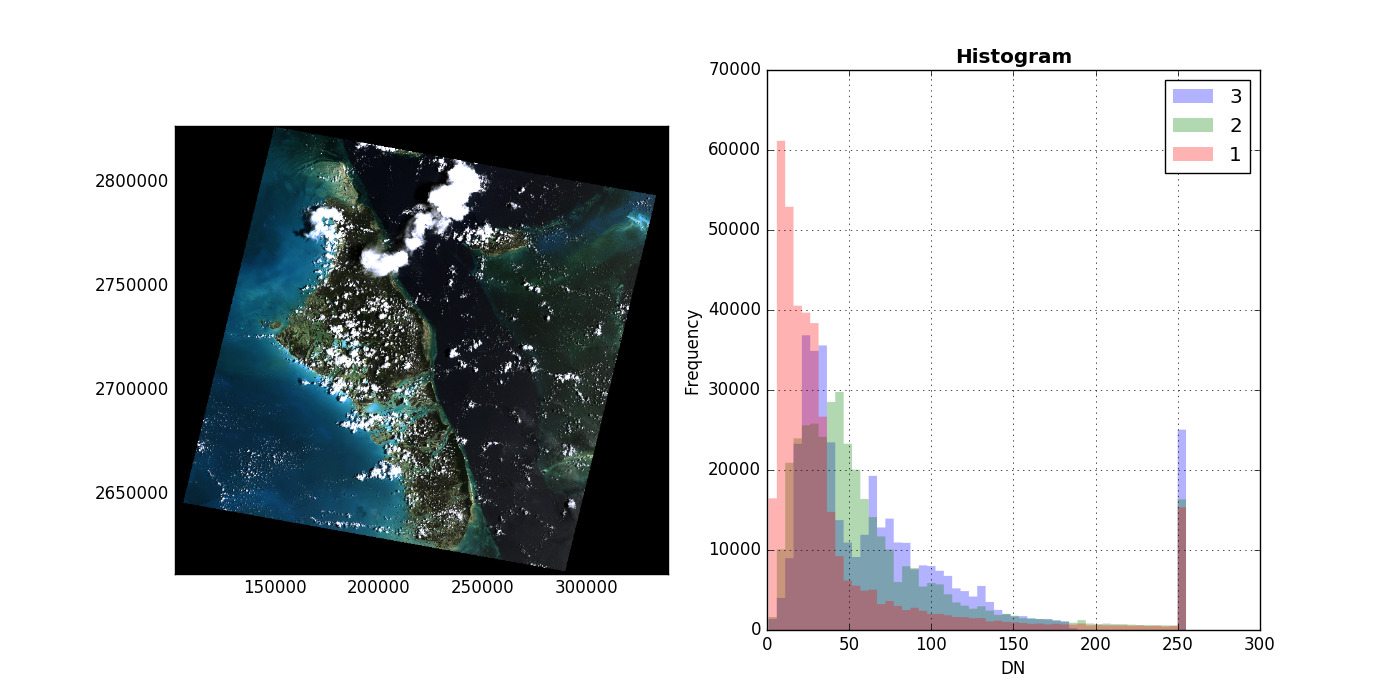
这个 show_hist 函数还需要 ax 允许子批次配置的参数
>>> fig, (axrgb, axhist) = pyplot.subplots(1, 2, figsize=(14,7))
>>> show(src, ax=axrgb)
<matplotlib.axes._subplots.AxesSubplot object at 0x...>
>>> show_hist(src, bins=50, histtype='stepfilled',
...           lw=0.0, stacked=False, alpha=0.3, ax=axhist)
>>> pyplot.show()