颜色
颜色解释
可以从数据集中读取栅格带的颜色解释。
>>> import rasterio
>>> src = rasterio.open("tests/data/RGB.byte.tif")
>>> src.colorinterp[0]
<ColorInterp.red: 3>
gdal基于驱动程序和创建选项构建颜色解释。与 GTiff 驱动程序,uint8类型的3个波段的栅格将是RGB,默认情况下,uint8的4个波段将是RGB。
使用创建新数据源时,可以设置颜色解释 photometric 创建选项:
>>> profile = src.profile
>>> profile['photometric'] = "RGB"
>>> with rasterio.open("/tmp/rgb.tif", 'w', **profile) as dst:
...     dst.write(src.read())
或者通过 colorinterp 在更新模式下打开数据源时的属性:
>>> from rasterio.enums import ColorInterp
>>> with rasterio.open('/tmp/rgb.tif', 'r+', **profile) as src:
...     src.colorinterp = [
...         ColorInterp.red, ColorInterp.green, ColorInterp.blue]
由此产生的栅格将被解释为RGB。
>>> with rasterio.open("/tmp/rgb.tif") as src2:
...     src2.colorinterp[1]
<ColorInterp.green: 4>
正在写入颜色映射
从8位(rasterio.uint8)像素值到rgba值的映射可以使用 write_colormap() 方法。
import rasterio

with rasterio.Env():

    with rasterio.open('tests/data/shade.tif') as src:
        shade = src.read(1)
        meta = src.meta

    with rasterio.open('/tmp/colormap.tif', 'w', **meta) as dst:
        dst.write(shade, indexes=1)
        dst.write_colormap(
            1, {
                0: (255, 0, 0, 255),
                255: (0, 0, 255, 255) })
        cmap = dst.colormap(1)
        # True
        assert cmap[0] == (255, 0, 0, 255)
        # True
        assert cmap[255] == (0, 0, 255, 255)

subprocess.call(['open', '/tmp/colormap.tif'])
上面的程序(在OS X上,需要另一个具有不同操作系统的查看器)生成下面的图像:
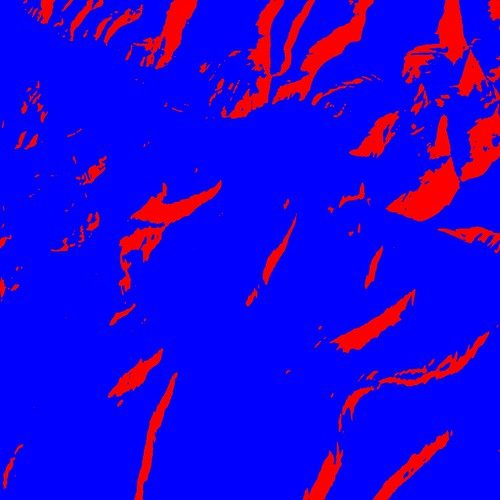
阅读彩色地图
如上图所示, colormap() 返回保存给定带区索引的颜色映射的dict。对于tiff格式的文件,colormap将有256个项目,在上面的示例中,除了两个项目外,其他项目都将映射到(0、0、0、0)。