了解 transform 和 projection 关键词#
人们很容易对什么感到困惑 projection 和 transform 关键词参数实际上意味着。在这里,我们将使用一些简单的例子来说明每种方法的效果。
核心概念是轴的投影独立于定义数据的坐标系。的 projection 参数用于创建图时,并确定结果图的投影(即图的外观)。的 transform 绘图函数的参数告诉Cartopy您的数据定义在哪个坐标系中。
首先,我们将创建一些在常规纬度/经度网格上定义的虚拟数据:
import numpy as np


lon = np.linspace(-80, 80, 25)
lat = np.linspace(30, 70, 25)
lon2d, lat2d = np.meshgrid(lon, lat)

data = np.cos(np.deg2rad(lat2d) * 4) + np.sin(np.deg2rad(lon2d) * 4)
让我们尝试在 PlateCarree 投影,但不指定 transform 论点由于数据恰好在与我们绘制的同一坐标系中定义,因此这实际上是正确的:
import cartopy.crs as ccrs
import matplotlib.pyplot as plt


# The projection keyword determines how the plot will look
plt.figure(figsize=(6, 3))
ax = plt.axes(projection=ccrs.PlateCarree())
ax.set_global()
ax.coastlines()

ax.contourf(lon, lat, data)  # didn't use transform, but looks ok...
plt.show()
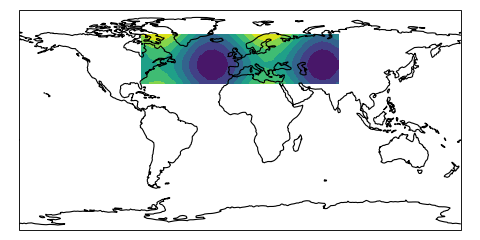
现在让我们加入 transform 我们绘图时的关键字:
# The data are defined in lat/lon coordinate system, so PlateCarree()
# is the appropriate choice:
data_crs = ccrs.PlateCarree()

# The projection keyword determines how the plot will look
plt.figure(figsize=(6, 3))
ax = plt.axes(projection=ccrs.PlateCarree())
ax.set_global()
ax.coastlines()

ax.contourf(lon, lat, data, transform=data_crs)
plt.show()

你看,情节没有改变?这是因为, transform 没有提供的论点是坐标系与投影匹配,到目前为止一直是这种情况。
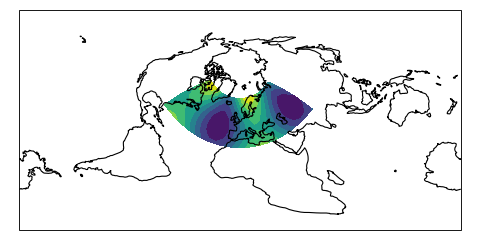
现在我们将再次尝试,但对我们的情节使用不同的投影。我们将绘制到旋转极点投影上,并省略 transform 参数来看看会发生什么:
# Now we plot a rotated pole projection
projection = ccrs.RotatedPole(pole_longitude=-177.5, pole_latitude=37.5)
plt.figure(figsize=(6, 3))
ax = plt.axes(projection=projection)
ax.set_global()
ax.coastlines()

ax.contourf(lon, lat, data)  # didn't use transform, uh oh!
plt.show()
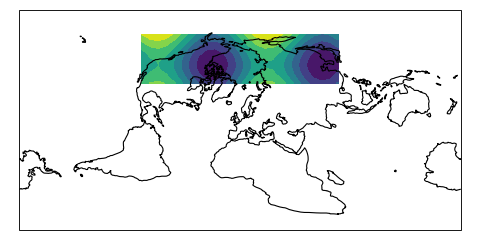
结果情节不正确!我们没有告诉Cartopy我们的数据定义在哪个坐标系中,所以它假设它与我们正在绘制的投影相同,并且数据被绘制在错误的位置。
我们可以通过提供 transform 参数,由于数据的坐标系没有更改,因此与以前相同:
# A rotated pole projection again...
projection = ccrs.RotatedPole(pole_longitude=-177.5, pole_latitude=37.5)
plt.figure(figsize=(6, 3))
ax = plt.axes(projection=projection)
ax.set_global()
ax.coastlines()

# ...but now using the transform argument
ax.contourf(lon, lat, data, transform=data_crs)
plt.show()
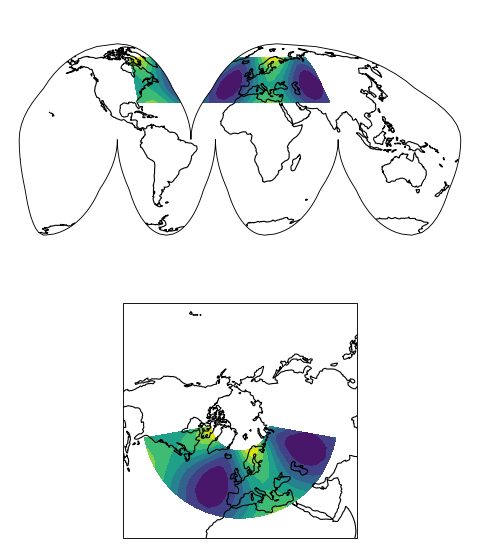
最安全的事情就是始终提供 transform 无论您使用的投影如何,都要使用关键字,并避免让Cartopy对您的数据的坐标系做出假设。这样做可以让您选择用于绘图的任何地图投影,并允许Cartopy将您的数据绘制在应有的位置:
# We can choose any projection we like...
projection = ccrs.InterruptedGoodeHomolosine()
plt.figure(figsize=(6, 7))
ax1 = plt.subplot(211, projection=projection)
ax1.set_global()
ax1.coastlines()
ax2 = plt.subplot(212, projection=ccrs.NorthPolarStereo())
ax2.set_extent([-180, 180, 20, 90], crs=ccrs.PlateCarree())
ax2.coastlines()

# ...as long as we provide the correct transform, the plot will be correct
ax1.contourf(lon, lat, data, transform=data_crs)
ax2.contourf(lon, lat, data, transform=data_crs)
plt.show()