制图地图网格线和勾号标签#
的 Gridliner 实例,通常通过调用 cartopy.mpl.geoaxes.GeoAxes.gridlines() 法在 cartopy.mpl.geoaxes.GeoAxes 例如,具有各种属性,可用于确定网格线和标签的绘制时间行为。
在第一个示例中,网格和标记标签以非矩形投影绘制,其中大多数默认值并且没有调整网格线属性:
import matplotlib.pyplot as plt
import cartopy.crs as ccrs

rotated_crs = ccrs.RotatedPole(pole_longitude=120.0, pole_latitude=70.0)

ax = plt.axes(projection=rotated_crs)
ax.set_extent([-6, 3, 48, 58], crs=ccrs.PlateCarree())
ax.coastlines(resolution='50m')
ax.gridlines(draw_labels=True, dms=True, x_inline=False, y_inline=False)

plt.show()

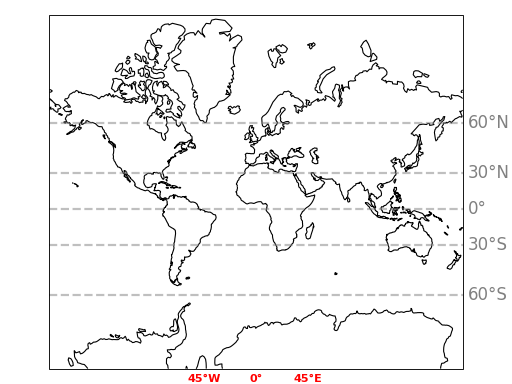
下面精心设计的示例利用Gridliner类的许多功能来生成自定义的网格线和勾选标签:
import matplotlib.pyplot as plt
import matplotlib.ticker as mticker
import cartopy.crs as ccrs

from cartopy.mpl.ticker import (LongitudeFormatter, LatitudeFormatter,
                                LatitudeLocator)


ax = plt.axes(projection=ccrs.Mercator())
ax.coastlines()

gl = ax.gridlines(crs=ccrs.PlateCarree(), draw_labels=True,
                  linewidth=2, color='gray', alpha=0.5, linestyle='--')
gl.top_labels = False
gl.left_labels = False
gl.xlines = False
gl.xlocator = mticker.FixedLocator([-180, -45, 0, 45, 180])
gl.ylocator = LatitudeLocator()
gl.xformatter = LongitudeFormatter()
gl.yformatter = LatitudeFormatter()
gl.ylabel_style = {'size': 15, 'color': 'gray'}
gl.xlabel_style = {'color': 'red', 'weight': 'bold'}

plt.show()