编写文档
目录
入门
常规文件结构
所有文档都是根据 doc/ , tutorials/ 和 examples/ 目录。这个 doc/ 目录包含Sphinx和RestructedText的配置文件 (ReST; .rst )呈现到文档页的文件。
主要入口点是 doc/index.rst 它把 index.rst 用户指南文件 (doc/users ),开发者指南 (doc/devel ),api参考 (doc/api ),以及常见问题解答 (doc/faq ). 为了最有效地使用交叉引用,文档套件被构建为单个文档。
Sphinx 也创造 .rst 在中暂存的文件 doc/api 来自Matplotlib库中类的docStrings。除了 doc/api/api_changes/ 这些 .rst 创建文档时会创建文件。
同样,内容 doc/gallery 和 doc/tutorials 是由 Sphinx Gallery 来源于 examples/ 和 tutorials/ . 这些源代码由具有 ReST 他们的评论中包含了文档。
注解
不要直接编辑 .rst 文件在 doc/gallery , doc/tutorials 和 doc/api (例外 doc/api/api_changes/ ) Sphinx 生成文档时在这些目录中重新生成文件。
正在安装依赖项
Matplotlib的文档是从RestructedText生成的。 (ReST) 使用 Sphinx 文档生成工具。要构建文档,您需要(1)设置适当的Python环境,(2)分别安装LaTeX和Graphviz。
要(1)为构建文档设置适当的Python环境,您应该:
- 在不安装Matplotlib的情况下创建一个干净的虚拟环境
- 安装Matplotlib所需的Python包
- 安装构建文档所需的其他Python包
构建文档需要几个额外的python包。它们列在 doc-requirements.txt ,如下图所示:
# Requirements for building docs
#
# You will first need a matching Matplotlib installation
# e.g (from the Matplotlib root directory)
#     pip install -e .
#
# Install the documentation requirements with:
#     pip install -r requirements/doc/doc-requirements.txt
#
sphinx>=1.8.1,!=2.0.0
colorspacious
ipython
ipywidgets
numpydoc>=0.8
sphinxcontrib-svg2pdfconverter>=1.1.0
sphinx-gallery>=0.7
sphinx-copybutton
scipy
要(2)设置LaTeX和Graphviz依赖项,您应该:
- 安装最小工作 Latex 分布
- 安装 Latex 包cm super和dvipng
- 安装 Graphviz
注解
如果没有LaTeX和Graphviz,文档将无法构建。这些不是Python包,必须单独安装。
构建文档
文件来源见 doc/ 后备箱中的目录。 Sphinx 的配置文件是 doc/conf.py . 它控制sphinx解析的目录、如何构建文档以及如何使用扩展。要以HTML格式构建文档,请将CD doc/ 然后运行:
make html
其他有用的调用包括
# Delete built files.  May help if you get errors about missing paths or
# broken links.
make clean

# Build pdf docs.
make latexpdf
这个 SPHINXOPTS 变量设置为 -W --keep-going 默认情况下,生成完整的文档,但如果出现警告,则退出状态为1。要取消设置,请使用
make SPHINXOPTS= html
在Windows上,参数必须位于语句末尾:
make html SPHINXOPTS=
你可以使用 O 用于设置其他选项的变量:
make O=-j4 html运行带有4个进程的并行生成。make O=-Dplot_formats=png:100 html以低分辨率保存数字。make O=-Dplot_gallery=0 html跳过库构建。
可以使用例如 make O='-j4 -Dplot_gallery=0' html .
在Windows上,使用上面显示的格式或将选项设置为环境变量,例如:
set O=-W --keep-going -j4
make html
正在写入休息页
大多数文档要么在单个类和方法的docstring中,要么在显式中 .rst 文件,或在示例和教程中。所有这些都使用 ReST 语法。用户应该查看 ReST 完整描述的文档。但是Matplotlib使用的一些特定提示和约定对于创建文档很有用。
格式和样式惯例
争取Matplotlib文档的一致性是有用的。下面是一些使用的格式和样式约定。
函数参数
应使用 *emphasis* 角色。这将使matplotlib的文档与python的文档保持一致:
Here is a description of *argument*
不要使用 `default role “:
Do not describe `argument` like this.  As per the next section,
this syntax will (unsuccessfully) attempt to resolve the argument as a
link to a class or method in the library.
也不 ``literal “角色:
Do not describe ``argument`` like this.
参考其他文件和章节
Sphinx 允许内部 references 文件之间。
文档可以链接到 :doc: 指令:
See the :doc:`/faq/installing_faq`

See the tutorial :doc:`/tutorials/introductory/sample_plots`

See the example :doc:`/gallery/lines_bars_and_markers/simple_plot`
将呈现为:
还可以为节指定引用名称。例如, 安装 链接:
.. _clean-install:

How to completely remove Matplotlib
===================================

Occasionally, problems with Matplotlib can be solved with a clean...
并使用标准引用语法引用:
See :ref:`clean-install`
将提供以下链接: 如何完全删除Matplotlib
要最大限度地提高节标记和引用的内部一致性,请对节引用使用连字符分隔的描述性标签。请记住,稍后可能会重新组织内容,因此避免在引用中使用顶级名称,如 user 或 devel 或 faq 除非有必要,因为例如常见问题解答“什么是后端?”以后可能会成为用户指南的一部分,因此标签:
.. _what-is-a-backend:
比:
.. _faq-backend:
此外,由于Sphinx本身广泛使用下划线,因此使用连字符分隔单词。
参考其他代码
要链接到matplotlib中的其他方法、类或模块,可以使用反勾号,例如:
`matplotlib.collections.LineCollection`
生成如下链接: matplotlib.collections.LineCollection .
注: 我们使用Sphinx设置 default_role = 'obj' 这样就不必使用限定符 :class: , :func: , :meth: 等等。
通常,您不想显示完整的包和模块名。只要目标是一致的,你就可以简单地忽略它们:
`.LineCollection`
链接仍然有效: LineCollection .
如果有多个具有相同名称的代码元素(例如 plot() 是多个类中的一个方法),您必须扩展定义:
`.pyplot.plot` or `.Axes.plot`
这些将显示为 pyplot.plot 或 Axes.plot . 要只显示最后一段,可以添加一个颚化符作为前缀:
`~.pyplot.plot` or `~.Axes.plot`
其他包也可以通过 intersphinx :
`numpy.mean`
将返回此链接: numpy.mean . 适用于 Python 、麻木、坐骨神经痛和熊猫(完整列表位于 doc/conf.py ). 如果外部链接失败,可以使用以下命令检查可引用对象的完整列表:
python -m sphinx.ext.intersphinx 'https://docs.python.org/3/objects.inv'
python -m sphinx.ext.intersphinx 'https://docs.scipy.org/doc/numpy/objects.inv'
python -m sphinx.ext.intersphinx 'https://docs.scipy.org/doc/scipy/reference/objects.inv'
python -m sphinx.ext.intersphinx 'https://pandas.pydata.org/pandas-docs/stable/objects.inv'
包括数字和文件
图像文件可以直接包含在 image:: 指令。例如。, thirdpartypackages/index.rst 将第三方包的图像显示为静态图像:
.. image:: /_static/toolbar.png
如页面所示: 第三方软件包 .
文件可以逐字包含。例如 matplotlibrc 文件对于自定义matplotlib很重要,它包含在教程中 使用样式表和RCPARAM自定义Matplotlib ::
.. literalinclude:: ../../_static/matplotlibrc
这是在 使用样式表和RCPARAM自定义Matplotlib . 请注意,这是一个教程;请参见 编写示例和教程 下面。
示例目录也复制到 doc/gallery 通过Sphinx库,可以使用
.. plot:: gallery/lines_bars_and_markers/simple_plot.py
请注意,生成绘图的python脚本被引用,而不是任何创建的绘图。 Sphinx 绘图示例将提供正确的参考文件时,建立。
正在写入文档字符串
大多数API文档都是用docstring编写的。这些是源代码中解释代码如何工作的注释块。
注解
文档的某些部分还不符合当前的文档样式。如果有疑问,请遵循这里给出的规则,而不是源代码中可能看到的规则。拉请求将docstring更新为当前样式是非常受欢迎的。
所有新的或编辑的文档字符串都应符合 numpydoc docstring guide . 大部分的 ReST 上面讨论的语法 (正在写入休息页 )可用于链接和引用。这些文档字符串最终填充 doc/api 目录并形成库的参考文档。
示例文档字符串
DocString示例如下:
def hlines(self, y, xmin, xmax, colors='k', linestyles='solid',
           label='', **kwargs):
    """
    Plot horizontal lines at each *y* from *xmin* to *xmax*.

    Parameters
    ----------
    y : float or array-like
        y-indexes where to plot the lines.

    xmin, xmax : float or array-like
        Respective beginning and end of each line. If scalars are
        provided, all lines will have the same length.

    colors : array-like of colors, default: 'k'

    linestyles : {'solid', 'dashed', 'dashdot', 'dotted'}, default: 'solid'

    label : str, default: ''

    Returns
    -------
    lines : `~matplotlib.collections.LineCollection`

    Other Parameters
    ----------------
    **kwargs : `~matplotlib.collections.LineCollection` properties

    See also
    --------
    vlines : vertical lines
    axhline: horizontal line across the axes
    """
见 hlines 有关如何呈现的文档。
这个 Sphinx 网站还包含大量 documentation 关于休息标记和使用Sphinx。
格式设置约定
基本的docstring约定在 numpydoc docstring guide 以及 Sphinx 文档。要记住一些特定于matplotlib的格式约定:
报价位置
单行docstring的引号位于同一行(pydocstyle D200)::
def get_linewidth(self):
    """Return the line width in points."""
多行docstring的引号位于单独的行上(pydocstyle D213)::
def set_linestyle(self, ls):
"""
Set the linestyle of the line.

[...]
"""
函数参数
应使用 *emphasis* 角色。这将使matplotlib的文档与python的文档保持一致:
If *linestyles* is *None*, the default is 'solid'.
不要使用 `default role 或 ``literal “角色:
Neither `argument` nor ``argument`` should be used.
字符串引号
matplotlib没有使用单引号或双引号的约定。当前代码中两者都有。
在给出字符串值时使用简单的单引号或双引号,例如
If 'tight', try to figure out the tight bbox of the figure.

No ``'extra'`` literal quotes.
不鼓励在文本周围使用额外的文字引号。虽然它们稍微改进了呈现的文档,但是它们的类型很麻烦,而且在纯文本文档中很难阅读。
参数类型说明
参数类型描述的主要目标是让人能够阅读和理解。如果可能的类型太复杂,请对类型描述进行简化,并在文本中更准确地解释类型。
一般来说, numpydoc docstring guide 惯例适用。以下规则在numpydoc约定不特定的地方展开。
使用 float 对于可以是任何数字的类型。
使用 (float, float) 描述二维位置。应该包括圆括号,以使元组更明显。
使用 array-like 对于齐次数字序列,通常可以是numpy.array。可使用以下方式指定维数: 2D , 3D , n-dimensional . 如果需要有表示尺寸大小的变量,请使用括号中的大写字母。 (array-like (M, N) ). 在文本中引用它们时,它们更容易阅读,不需要特殊格式。
float 是类似数组的隐式默认数据类型。用于其他数据类型 array-like of int .
一些可能的用途:
2D array-like
array-like (N)
array-like (M, N)
array-like (M, N, 3)
array-like of int
非数值齐次序列描述为列表,例如:
list of str
list of `.Artist`
引用类型
一般来说,规则来自 referring-to-other-code 申请。更具体地说:
使用完整引用 `~matplotlib.colors.Normalize 参数类型中带有缩写tilde。虽然全名有助于阅读纯文本文档字符串,但HTML在链接到它时不需要显示全名。因此, ``~` -缩短使其更易于阅读。
使用缩写链接 `.Normalize 在课文中。
norm : `~matplotlib.colors.Normalize`, optional
     A `.Normalize` instance is used to scale luminance data to 0, 1.
默认值
与numpydoc指南相反,参数不需要标记为 可选择的 如果它们有一个简单的默认值:
- 使用
{{name}} : {{type}}, default: {{val}}如果可能的话。 - 使用
{{name}} : {{type}}, optional如果不能以推荐的方式进行充分解释,请在文本中描述默认值。
默认值应该提供针对人类读者的语义信息。在简单的情况下,它重述函数签名中的值。如适用,应添加单位。
Prefer:
    interval : int, default: 1000ms
over:
    interval : int, default: 1000
如果 None 仅用作“未指定参数”的哨兵值,不要将其作为默认值记录。根据上下文,提供实际的默认值,如果不指定没有任何特殊效果,则将参数标记为可选。
Prefer:
    dpi : float, default: :rc:`figure.dpi`
over:
    dpi : float, default: None

Prefer:
    textprops : dict, optional
        Dictionary of keyword parameters to be passed to the
        `~matplotlib.text.Text` instance contained inside TextArea.
over:
    textprops : dict, default: None
        Dictionary of keyword parameters to be passed to the
        `~matplotlib.text.Text` instance contained inside TextArea.
See also 部分
sphinx自动链接定义块中的代码元素 See also 部分。不需要在那里使用反勾号:
See also
--------
vlines : vertical lines
axhline: horizontal line across the axes
包装参数列表
长参数列表应使用 \ 对于continuation,并且从新行开始,没有任何缩进(没有缩进,因为pydoc将解析docstring并去掉行的继续部分,这样indent将导致行内出现大量空白):
def add_axes(self, *args, **kwargs):
    """
    ...

    Parameters
    ----------
    projection : {'aitoff', 'hammer', 'lambert', 'mollweide', 'polar', \
'rectilinear'}, optional
        The projection type of the axes.

    ...
    """
或者,您可以在docstring的专用部分中描述有效的参数值。
二传手和接球手
艺术家属性是使用setter和getter方法实现的(因为matplotlib早于 property python中的decorator)。按照惯例,这些setter和getter被命名为 set_PROPERTYNAME 和 get_PROPERTYNAME ;艺术家上定义的属性列表及其值可以通过 setp 和 getp 功能。
对属性setter方法的参数块进行分析,以记录可接受的值,例如 Line2D.set_linestyle 从开始
def set_linestyle(self, ls):
    """
    Set the linestyle of the line.

    Parameters
    ----------
    ls : {'-', '--', '-.', ':', '', (offset, on-off-seq), ...}
        etc.
    """
这将导致 plt.setp(line) 或 plt.setp(line, "linestyle") ::
linestyle or ls: {'-', '--', '-.', ':', '', (offset, on-off-seq), ...}
在一些罕见的情况下(大多数情况下,setter同时接受一个元组和一个未打包的元组),不能以这种方式记录接受的值;在这种情况下,可以将它们记录为 .. ACCEPTS: 块,例如 axes.Axes.set_xlim :
def set_xlim(self, ...):
    """
    Set the x-axis view limits.

    Parameters
    ----------
    left : float, optional
        The left xlim in data coordinates. Passing *None* leaves the
        limit unchanged.

        The left and right xlims may also be passed as the tuple
        (*left*, *right*) as the first positional argument (or as
        the *left* keyword argument).

        .. ACCEPTS: (bottom: float, top: float)

    right : float, optional
        etc.
    """
请注意 .. 使 .. ACCEPTS: 阻止reST注释,对呈现的文档隐藏它。
关键字参数
注解
开发团队正在积极讨论本节中的信息,因此只有在必要时才使用docstring插值。由于此插值是现有文档的一部分,因此本节暂时保留。
因为Matplotlib使用了大量的传递 kwargs 例如,在创建行的每个函数中 (plot , semilogx , semilogy 等等),新用户可能很难知道 kwargs 支持。matplotlib使用docstring插值方案来支持采用 **kwargs . 要求如下:
- 单点配置,因此对属性的更改不需要多个docstring编辑。
- 尽可能自动化,以便随着属性的变化,文档会自动更新。
函数 matplotlib.artist.kwdoc 还有装饰师 matplotlib.docstring.dedent_interpd 促进这一点。他们将docstring中的python字符串插值与matplotlib艺术家自省功能结合在一起 setp 和 getp . 这个 kwdoc 函数将属性列表作为docstring提供。为了在另一个docstring中使用它,首先更新 matplotlib.docstring.interpd 对象,如本示例中所示 matplotlib.lines :
# in lines.py
docstring.interpd.update(Line2D=artist.kwdoc(Line2D))
然后在任何功能接受 Line2D 通过 kwargs ,例如, matplotlib.axes.Axes.plot :
# in axes.py
@docstring.dedent_interpd
def plot(self, *args, **kwargs):
    """
    Some stuff omitted

    The kwargs are Line2D properties:
    %(_Line2D_docstr)s

    kwargs scalex and scaley, if defined, are passed on
    to autoscale_view to determine whether the x and y axes are
    autoscaled; default True.  See Axes.autoscale_view for more
    information
    """
注意,有一个问题 Artist _ _ init_uu``方法,例如, `matplotlib.patches.Patch.__init__` ,支持 ``Patch kwargs ,因为在类完全定义之前,艺术家检查器无法工作,并且我们无法修改 Patch.__init__.__doc__ 类定义之外的DocString。在这种情况下,有一些手动黑客,违反了上面的“单入口点”要求——请参见 docstring.interpd.update 来电 matplotlib.patches .
继承文档字符串
如果一个子类重写了一个方法,但没有改变语义,我们可以为子类的方法重用父docstring。如果子类方法没有docstring,则python会自动执行此操作。
使用普通注释 # docstring inherited 表示重用父docstring的意图。这样我们就不会在将来意外地创建docstring::
class A:
    def foo():
        """The parent docstring."""
        pass

class B(A):
    def foo():
        # docstring inherited
        pass
加数字
如上所见(见) 包括数字和文件 )示例库中的图形可以用 :plot: 指向创建图形的python脚本的指令。例如 legend docstring引用文件 examples/text_labels_and_annotations/legend.py :
"""
...

Examples
--------

.. plot:: gallery/text_labels_and_annotations/legend.py
"""
注意 examples/text_labels_and_annotations/legend.py 已映射到 gallery/text_labels_and_annotations/legend.py ,在将来重新组织文档时可能会修复的重定向。
绘图也可以直接放置在docstring中。详情在 matplotlib.sphinxext.plot_directive . 一个简短的例子是:
"""
...

Examples
--------

.. plot::
   import matplotlib.image as mpimg
   img = mpimg.imread('_static/stinkbug.png')
   imgplot = plt.imshow(img)
"""
与引用示例脚本相比,这种风格的一个优点是代码也将出现在交互式文档字符串中。
编写示例和教程
示例和教程是由 Sphinx Gallery 在中创建图像库 /doc/gallery 和 /doc/tutorials 目录。要从生成的绘图中排除示例,请在文件名的某个位置插入“sgskip”。
这些文件的格式相对简单。正确格式化的注释块被视为 ReST 文本,显示代码,并将数字放入构建页面。
比如这个例子 简单情节 示例生成自 /examples/lines_bars_and_markers/simple_plot.py ,看起来像:
"""
===========
Simple Plot
===========

Create a simple plot.
"""
import matplotlib.pyplot as plt
import numpy as np

# Data for plotting
t = np.arange(0.0, 2.0, 0.01)
s = 1 + np.sin(2 * np.pi * t)

# Note that using plt.subplots below is equivalent to using
# fig = plt.figure and then ax = fig.add_subplot(111)
fig, ax = plt.subplots()
ax.plot(t, s)

ax.set(xlabel='time (s)', ylabel='voltage (mV)',
       title='About as simple as it gets, folks')
ax.grid()
plt.show()
第一个注释块被视为 ReST 文本。其他注释块在中呈现为注释 简单情节 .
教程使用完全相同的机制进行制作,只是它们比较长,并且通常具有多个注释块(即 使用指南 )第一个注释块可以与上面的示例相同。后续的REST文本块由一行 ### 字符:
"""
===========
Simple Plot
===========

Create a simple plot.
"""
...
ax.grid()
plt.show()

##########################################################################
# Second plot
# ===========
#
# This is a second plot that is very nice

fig, ax = plt.subplots()
ax.plot(np.sin(range(50)))
通过这种方式,文本、代码和数字以“笔记本”样式输出。
图库中的示例顺序
各部分的顺序 教程 以及 绘图示例 ,以及每个部分中的示例的顺序是通过两步过程从中确定的。 /doc/sphinxext/gallery_order.py :
- 显式订单 :此文件包含节顺序的文件夹列表和小节顺序的示例列表。文档页面中显示的项目顺序是这些项目在这些列表中的显示顺序。
- 隐序 :如果某个文件夹或示例不在这些列表中,它将被追加到显式排序的项目之后,并且所有这些附加项目将按路径名(对于节)或文件名(对于子部分)排序。
因此,如果您想让示例出现在图库中的某个位置,可以使用示例扩展这些列表。如果不需要或不需要明确的顺序,仍然要确保将示例命名一致,即使用示例的主函数或主题作为文件名中的第一个词;例如,理想情况下,图像示例的命名应类似于 imshow_mynewexample.py .
其他
添加动画
狮身人面像画廊自动抓取动画。如果不需要这样做,还有一个Matplotlib Google/Gmail帐户,用户名为 mplgithub 它用于设置Github帐户,但也可用于其他目的,如托管谷歌文档或YouTube视频。通过首先将动画保存为电影,可以在文档中嵌入matplotlib动画,方法是使用 matplotlib.animation.Animation.save() ,然后上载到 Matplotlib's Youtube channel 插入嵌入字符串YouTube提供如下功能:
.. raw:: html

   <iframe width="420" height="315"
     src="http://www.youtube.com/embed/32cjc6V0OZY"
     frameborder="0" allowfullscreen>
   </iframe>
生成电影的示例save命令如下
ani = animation.FuncAnimation(fig, animate, np.arange(1, len(y)),
    interval=25, blit=True, init_func=init)

ani.save('double_pendulum.mp4', fps=15)
联系michael droettboom获取登录密码,将google docs的youtube视频上传到mplgithub帐户。
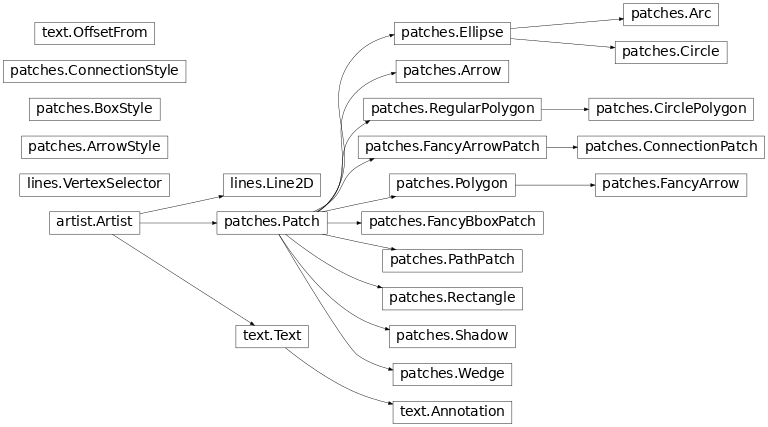
生成继承关系图
类继承关系图可以用 inheritance-diagram 指令。要使用它,请为该指令提供一些类或模块名(用空格分隔)。如果提供了模块名,则将使用该模块中的所有类。这些类的所有祖先都将包含在继承关系图中。
单一选项可用: 部分 控制类路径中显示的零件数。例如,如果 部分 = 1,班级 matplotlib.patches.Patch 如图所示 Patch . 如果 部分 ==2,表示为 patches.Patch . 如果 部分 ==0,显示完整路径。
例子:
.. inheritance-diagram:: matplotlib.patches matplotlib.lines matplotlib.text
   :parts: 2
EMACS助手
存在Emacs模式 rst.el 它自动化了许多重要的休息任务,如构建和更新目录,以及提升或降级节标题。这是基本的 .emacs 配置:
(require 'rst)
(setq auto-mode-alist
      (append '(("\\.txt$" . rst-mode)
                ("\\.rst$" . rst-mode)
                ("\\.rest$" . rst-mode)) auto-mode-alist))
一些有用的功能:
C-c TAB - rst-toc-insert

  Insert table of contents at point

C-c C-u - rst-toc-update

    Update the table of contents at point

C-c C-l rst-shift-region-left

    Shift region to the left

C-c C-r rst-shift-region-right

    Shift region to the right