mpl_toolkits.axes_grid1.axes_rgb.RGBAxes
-
class
mpl_toolkits.axes_grid1.axes_rgb.RGBAxes(*args, pad=0, add_all=<deprecated parameter>, **kwargs)[源代码]¶ 基类:
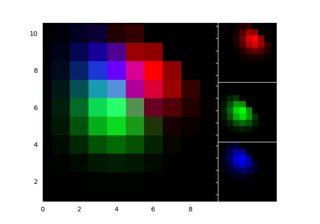
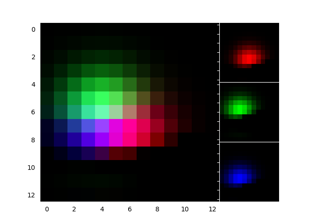
object四面板imshow(RGB、R、G、B)。
布局:+-----------+-----+R+-----+RGB G+-----+B+-----------+-----+
子类可以重写
_defaultAxesClass属性。属性: - RGB :
_defaultAxesClass_defaultAxesClass 三通道imshow的axes对象。
- R :
_defaultAxesClass_defaultAxesClass 红色通道imshow的axes对象。
- G :
_defaultAxesClass_defaultAxesClass 绿色通道imshow的axes对象。
- B :
_defaultAxesClass_defaultAxesClass 蓝色通道imshow的axes对象。
参数: - pad浮点,默认值:0
作为填充的轴高度的分数。
- add_allbool,默认值:True
是否将{rgb,r,g,b}轴添加到图形中。此参数已弃用。
- axes_classmatplotlib.axes.Axes
- *args
解包到rgb的axes_class()init中
- **kwargs
解包到r g b、r、g、b轴的轴_class()init中
-
__dict__= mappingproxy({'__module__': 'mpl_toolkits.axes_grid1.axes_rgb', '__doc__': '\n 4-panel imshow (RGB, R, G, B).\n\n Layout:\n +---------------+-----+\n | | R |\n + +-----+\n | RGB | G |\n + +-----+\n | | B |\n +---------------+-----+\n\n Subclasses can override the ``_defaultAxesClass`` attribute.\n\n Attributes\n ----------\n RGB : ``_defaultAxesClass``\n The axes object for the three-channel imshow.\n R : ``_defaultAxesClass``\n The axes object for the red channel imshow.\n G : ``_defaultAxesClass``\n The axes object for the green channel imshow.\n B : ``_defaultAxesClass``\n The axes object for the blue channel imshow.\n ', '_defaultAxesClass': <class 'mpl_toolkits.axes_grid1.mpl_axes.Axes'>, '__init__': <function RGBAxes.__init__>, 'add_RGB_to_figure': <function RGBAxes.add_RGB_to_figure>, 'imshow_rgb': <function RGBAxes.imshow_rgb>, '__dict__': <attribute '__dict__' of 'RGBAxes' objects>, '__weakref__': <attribute '__weakref__' of 'RGBAxes' objects>, '__annotations__': {}})
-
__init__(*args, pad=0, add_all=<deprecated parameter>, **kwargs)[源代码]¶ 参数: - pad浮点,默认值:0
作为填充的轴高度的分数。
- add_allbool,默认值:True
是否将{rgb,r,g,b}轴添加到图形中。此参数已弃用。
- axes_classmatplotlib.axes.Axes
- *args
解包到rgb的axes_class()init中
- **kwargs
解包到r g b、r、g、b轴的轴_class()init中
-
__module__= 'mpl_toolkits.axes_grid1.axes_rgb'
-
__weakref__¶ 对象的弱引用列表(如果已定义)
- RGB :