距离变换
本节中的示例位于源代码中的 mahotas/demos/distance.py 。
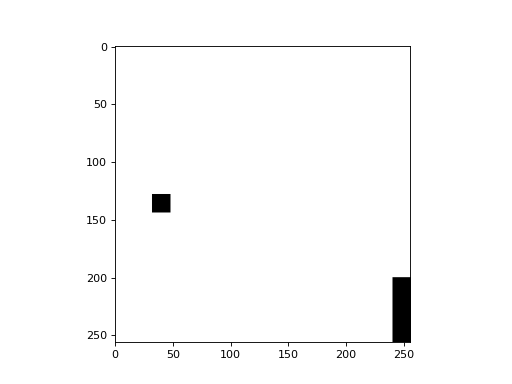
我们从一个图像开始,这是一个黑白图像,除了两个白点外,大部分是黑色的::
import numpy as np
import mahotas

f = np.ones((256,256), bool)
f[200:,240:] = False
f[128:144,32:48] = False
from pylab import imshow, gray, show
import numpy as np

f = np.ones((256,256), bool)
f[200:,240:] = False
f[128:144,32:48] = False

gray()
imshow(f)
show()
(Source code, png, hires.png, pdf)
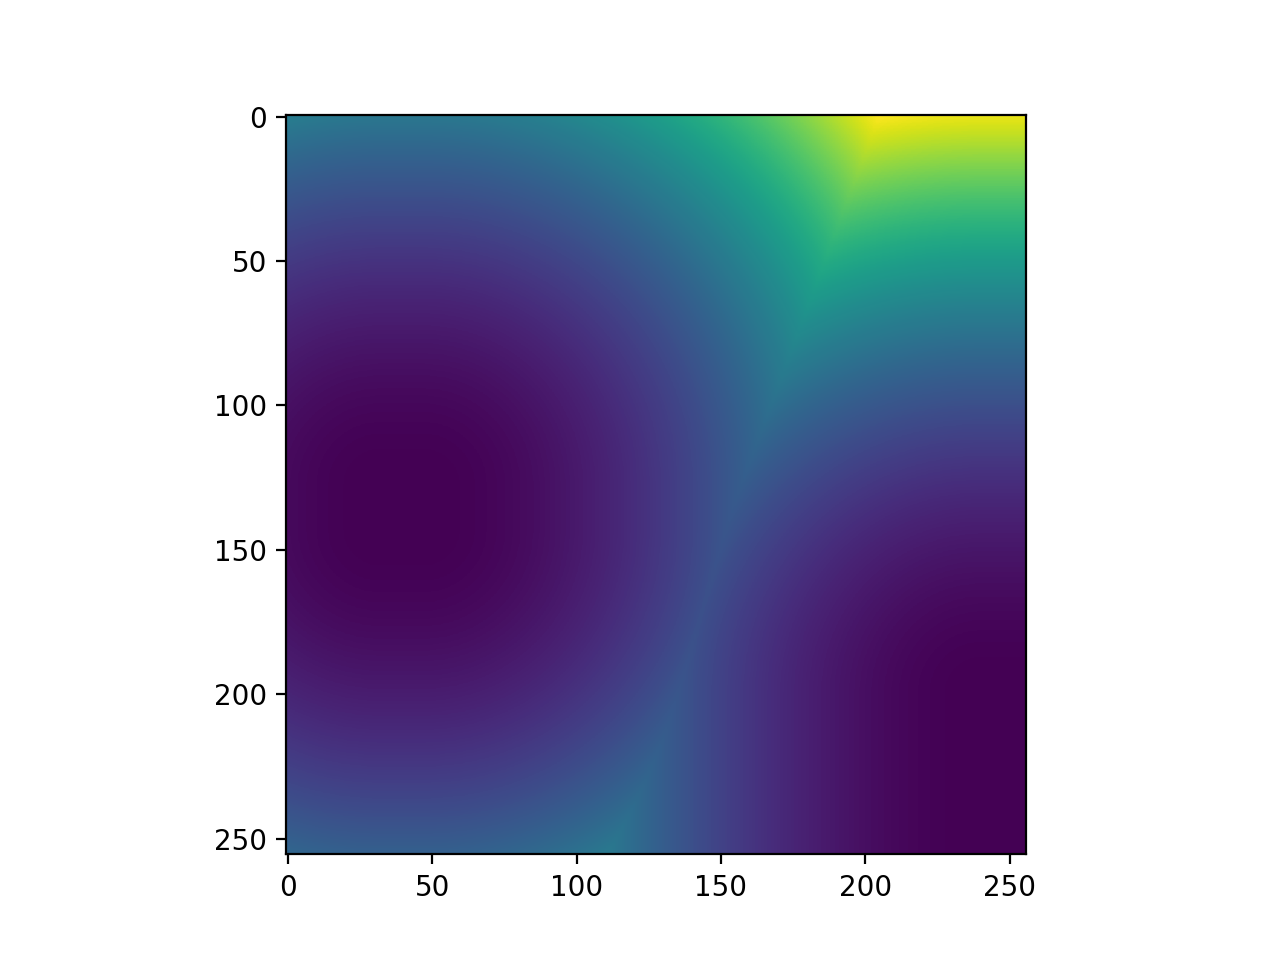
有一个简单的 distance() 计算距离图的函数::
import mahotas
dmap = mahotas.distance(f)
现在 dmap[y,x] 包含像素的平方欧几里得距离。 (y,x) 中最接近的黑色像素 f 。如果 f[y,x] == True ,那么 dmap[y,x] == 0 。
from __future__ import print_function

import pylab as p
import numpy as np
import mahotas

f = np.ones((256,256), bool)
f[200:,240:] = False
f[128:144,32:48] = False
# f is basically True with the exception of two islands: one in the lower-right
# corner, another, middle-left

dmap = mahotas.distance(f)
p.imshow(dmap)
p.show()
(Source code, png, hires.png, pdf)

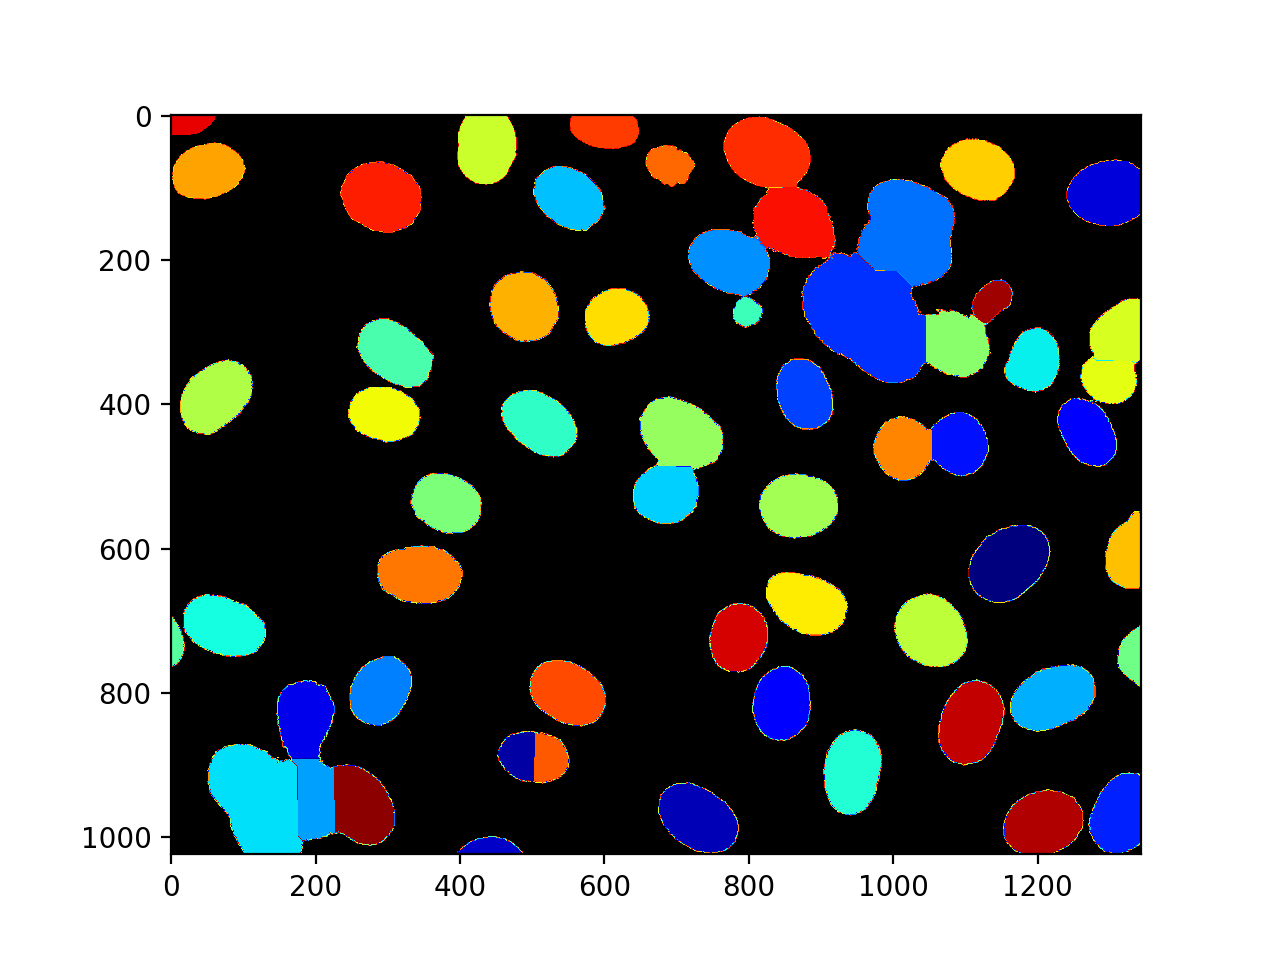
距离变换与分水岭
通常将距离变换与分水岭相结合进行分割。下面是一个示例(源代码位于 mahotas/demos/ 目录为 nuclear_distance_watershed.py )。
import mahotas as mh
from os import path
import numpy as np
from matplotlib import pyplot as plt

nuclear = mh.demos.load('nuclear')
nuclear = nuclear[:,:,0]
nuclear = mh.gaussian_filter(nuclear, 1.)
threshed  = (nuclear > nuclear.mean())
distances = mh.stretch(mh.distance(threshed))
Bc = np.ones((9,9))

maxima = mh.morph.regmax(distances, Bc=Bc)
spots,n_spots = mh.label(maxima, Bc=Bc)
surface = (distances.max() - distances)
areas = mh.cwatershed(surface, spots)
areas *= threshed


import random
from matplotlib import colors
from matplotlib import cm
cols = [cm.jet(c) for c in range(0, 256, 4)]
random.shuffle(cols)
cols[0] = (0.,0.,0.,1.)
rmap = colors.ListedColormap(cols)
plt.imshow(areas, cmap=rmap)
plt.show()
(Source code, png, hires.png, pdf)

代码并不是很复杂。首先加载图像,并使用高斯模糊::
import mahotas
import mahotas.demos

nuclear = mahotas.demos.nuclear_image()
nuclear = nuclear[:,:,0]
nuclear = mahotas.gaussian_filter(nuclear, 1.)
threshed  = (nuclear > nuclear.mean())
现在,我们计算距离变换::
distances = mahotas.stretch(mahotas.distance(threshed))
我们找到并标记区域最大值::
Bc = np.ones((9,9))
maxima = mahotas.morph.regmax(distances, Bc=Bc)
spots,n_spots = mahotas.label(maxima, Bc=Bc)
最后,为了获得上面的图像,我们反转距离变换(因为这种方式 cwatershed 已定义)并计算分水岭:
surface = (distances.max() - distances)
areas = mahotas.cwatershed(surface, spots)
areas *= threshed
我们使用了一个黑色背景的随机色彩映射表作为最终图像。这是通过以下方式实现的:
import random
from matplotlib import colors as c
colors = map(cm.jet,range(0, 256, 4))
random.shuffle(colors)
colors[0] = (0.,0.,0.,1.)
rmap = c.ListedColormap(colors)
imshow(areas, cmap=rmap)
show()
API文档
这是一个用Python语言编写的计算机视觉包。
主要特征
- 特征
计算全局和局部特征(几个子模块,包括SURF和Haralick特征)
- 卷积
卷积与小波
- 变形
形态特征。大多数是在mahotas级别提供的,包括腐蚀()、扩张()...
- 分水岭
种子分水岭实施
- 不读取/不保存
读/写图像
文档:https://mahotas.readthedocs.io/
引文:
科埃略,路易斯·佩德罗,2013年。Mahotas:用于可编写脚本的计算机视觉的开源软件。开放研究软件杂志,1:E3,DOI:https://dx.doi.org/10.5334/jors.ac
- mahotas.distance(bw, metric='euclidean2')
计算图像的距离变换 bw **
dmap[i,j] = min_{i', j'} { (i-i')**2 + (j-j')**2 | !bw[i', j'] }也就是说,在每个点上,计算到背景的距离。
如果没有背景,那么将在所有像素中返回一个非常高的值(这是一种无穷大)。
- 参数:
- bwNdarray
如果是布尔值,
False将表示背景和True前台。如果不是布尔值,则会被解释为bw != 0(这样,您就可以毫无问题地使用带标签的图像)。- metric字符串,可选
‘euclidean2’(默认)或‘euclidean2’之一
- 退货:
- dmapNdarray
距离图
参考文献
对于2-D图像,使用以下算法:
首页--期刊主要分类--期刊细介绍--期刊细介绍 Distance transforms of sampled functions. Cornell Computing and Information. 2004年。
可在以下网址获得:https://citeseerx.ist.psu.edu/viewdoc/download?doi=10.1.1.88.1647&rep=rep1&type=pdf.
对于n维图像(n>2),使用较慢的手工方法。