绘图示例
有关以不同方式使用Bokeh的示例,请参见下面的部分。
服务器应用程序示例
下面链接的示例都展示了Bokeh服务器的用法。Bokeh服务器提供了一个有趣的地方——数据可以被更新来更新绘图,UI和选择事件可以被处理以触发更多的可视化更新。

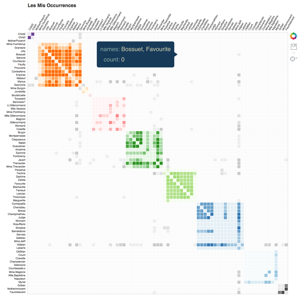
An interactive query tool for a set of IMDB data
Source code: movies

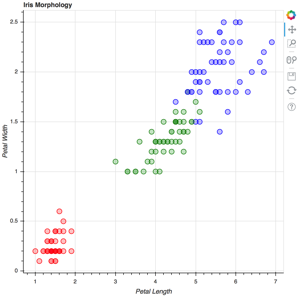
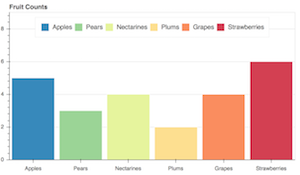
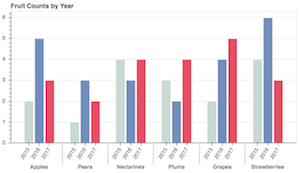
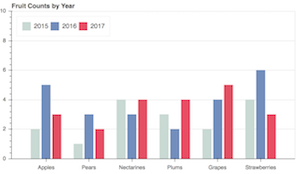
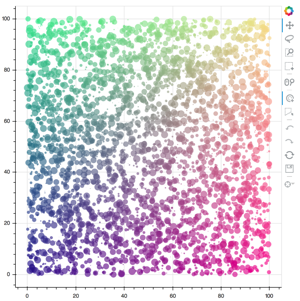
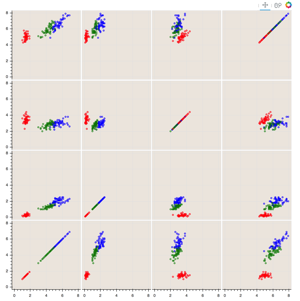
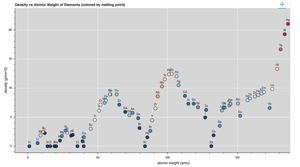
Shows axis histograms for selected and non-selected points in a scatter plot
Source code: selection_histogram

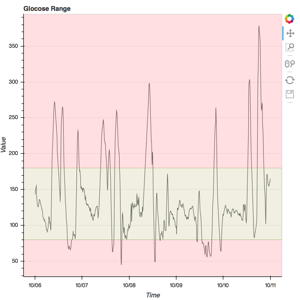
Interactive weather statistics for three cities
Source code: weather

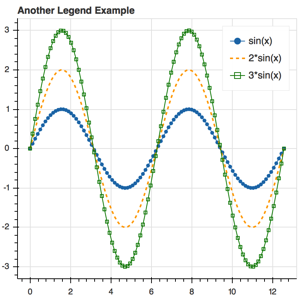
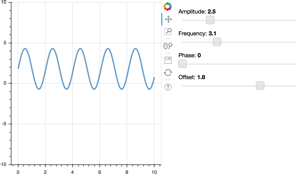
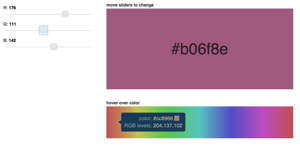
A basic demo that has sliders for controlling a plotted trigonometric function
Source code: sliders.py

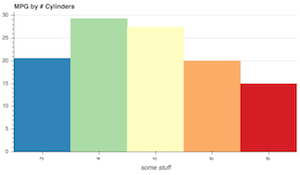
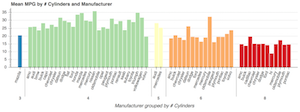
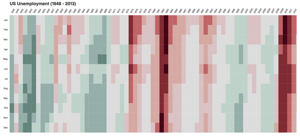
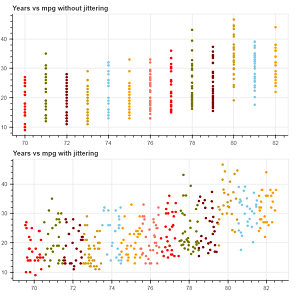
Explore the "autompg" data set by selecting and highlighting different dimensions
Source code: crossfilter

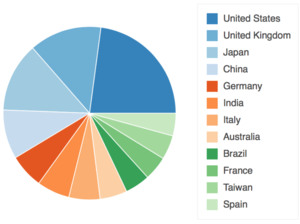
A reproduction of the famous Gapminder demo, with embedded video added using a custom page template
Source code: gapminder

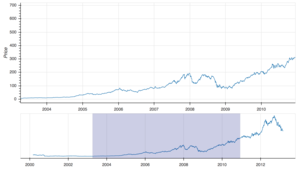
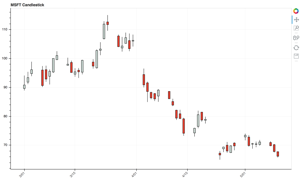
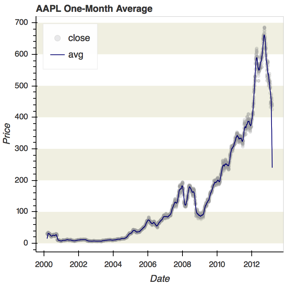
Linked plots, summary statistics, and correlations for market data
Source code: stocks

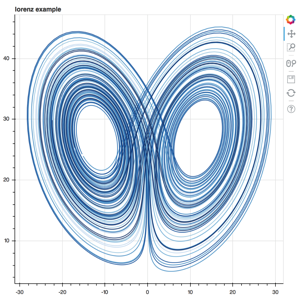
An updating 3d plot that demonstrates using using Bokeh custom extensions to wrap third-party JavaScript libraries
Source code: surface3d

Explore the "autompg" data set by selecting and highlighting different dimensions
Source code: export_csv
笔记本示例
最好马上把笔记本放在笔记本上 live tutorial notebooks 由MyBinder在线主持。静态版本也可以在线查看(或下载并在本地执行) Bokeh NBViewer Gallery .