备注
点击 here 下载完整的示例代码
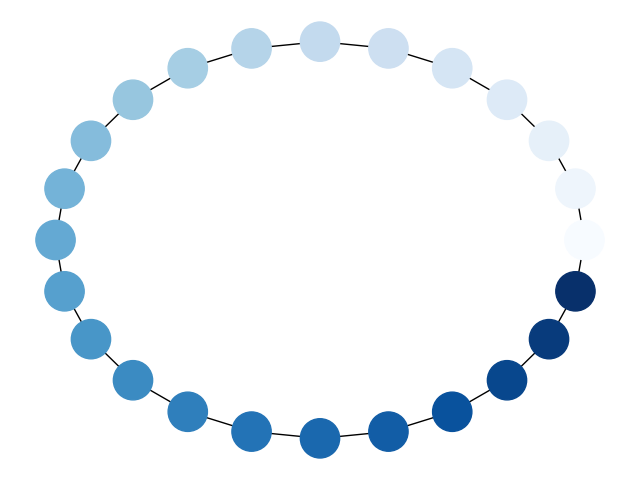
节点色图#
用matplotlib绘制一个图表,按度数着色。
import matplotlib.pyplot as plt
import networkx as nx

G = nx.cycle_graph(24)
pos = nx.circular_layout(G)
nx.draw(G, pos, node_color=range(24), node_size=800, cmap=plt.cm.Blues)
plt.show()
Total running time of the script: ( 0 minutes 0.042 seconds)