备注
点击 here 下载完整的示例代码
戴维斯俱乐部#
戴维斯南方俱乐部女性
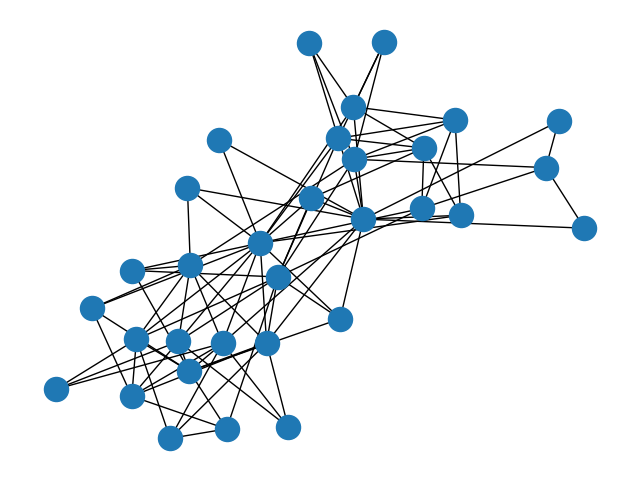
演示如何对图进行单粒子投影并计算这些图的属性。
这些数据由Davis等人收集。在20世纪30年代,他们代表18名南方妇女参加了14次社会活动。图表是两党的(俱乐部,女人)。
出:
Biadjacency matrix
  (0, 0)        1
  (0, 1)        1
  (0, 2)        1
  (0, 3)        1
  (0, 4)        1
  (0, 5)        1
  (0, 7)        1
  (0, 8)        1
  (1, 0)        1
  (1, 1)        1
  (1, 2)        1
  (1, 4)        1
  (1, 5)        1
  (1, 6)        1
  (1, 7)        1
  (2, 1)        1
  (2, 2)        1
  (2, 3)        1
  (2, 4)        1
  (2, 5)        1
  (2, 6)        1
  (2, 7)        1
  (2, 8)        1
  (3, 0)        1
  (3, 2)        1
  :     :
  (12, 7)       1
  (12, 8)       1
  (12, 9)       1
  (12, 11)      1
  (12, 12)      1
  (12, 13)      1
  (13, 5)       1
  (13, 6)       1
  (13, 8)       1
  (13, 9)       1
  (13, 10)      1
  (13, 11)      1
  (13, 12)      1
  (13, 13)      1
  (14, 6)       1
  (14, 7)       1
  (14, 9)       1
  (14, 10)      1
  (14, 11)      1
  (15, 7)       1
  (15, 8)       1
  (16, 8)       1
  (16, 10)      1
  (17, 8)       1
  (17, 10)      1

#Friends, Member
17 Evelyn Jefferson
15 Laura Mandeville
17 Theresa Anderson
15 Brenda Rogers
11 Charlotte McDowd
15 Frances Anderson
15 Eleanor Nye
16 Pearl Oglethorpe
17 Ruth DeSand
17 Verne Sanderson
16 Myra Liddel
16 Katherina Rogers
17 Sylvia Avondale
17 Nora Fayette
17 Helen Lloyd
16 Dorothy Murchison
12 Olivia Carleton
12 Flora Price

#Friend meetings, Member
50 Evelyn Jefferson
45 Laura Mandeville
57 Theresa Anderson
46 Brenda Rogers
24 Charlotte McDowd
32 Frances Anderson
36 Eleanor Nye
31 Pearl Oglethorpe
40 Ruth DeSand
38 Verne Sanderson
33 Myra Liddel
37 Katherina Rogers
46 Sylvia Avondale
43 Nora Fayette
34 Helen Lloyd
24 Dorothy Murchison
14 Olivia Carleton
14 Flora Price
import matplotlib.pyplot as plt
import networkx as nx
import networkx.algorithms.bipartite as bipartite

G = nx.davis_southern_women_graph()
women = G.graph["top"]
clubs = G.graph["bottom"]

print("Biadjacency matrix")
print(bipartite.biadjacency_matrix(G, women, clubs))

# project bipartite graph onto women nodes
W = bipartite.projected_graph(G, women)
print()
print("#Friends, Member")
for w in women:
    print(f"{W.degree(w)} {w}")

# project bipartite graph onto women nodes keeping number of co-occurence
# the degree computed is weighted and counts the total number of shared contacts
W = bipartite.weighted_projected_graph(G, women)
print()
print("#Friend meetings, Member")
for w in women:
    print(f"{W.degree(w, weight='weight')} {w}")

pos = nx.spring_layout(G, seed=648)  # Seed layout for reproducible node positions
nx.draw(G, pos)
plt.show()
Total running time of the script: ( 0 minutes 0.062 seconds)