备注
单击 here 要下载完整的示例代码,请执行以下操作
子图#
将节点标记为支持和不支持节点的有向图划分为仅包含完全支持或完全不支持节点的子图列表的示例。摘自https://github.com/lobpcg/python_examples/blob/master/networkx_example.py
import networkx as nx
import matplotlib.pyplot as plt
def graph_partitioning(G, plotting=True):
"""Partition a directed graph into a list of subgraphs that contain
only entirely supported or entirely unsupported nodes.
"""
# Categorize nodes by their node_type attribute
supported_nodes = {n for n, d in G.nodes(data="node_type") if d == "supported"}
unsupported_nodes = {n for n, d in G.nodes(data="node_type") if d == "unsupported"}
# Make a copy of the graph.
H = G.copy()
# Remove all edges connecting supported and unsupported nodes.
H.remove_edges_from(
(n, nbr, d)
for n, nbrs in G.adj.items()
if n in supported_nodes
for nbr, d in nbrs.items()
if nbr in unsupported_nodes
)
H.remove_edges_from(
(n, nbr, d)
for n, nbrs in G.adj.items()
if n in unsupported_nodes
for nbr, d in nbrs.items()
if nbr in supported_nodes
)
# Collect all removed edges for reconstruction.
G_minus_H = nx.DiGraph()
G_minus_H.add_edges_from(set(G.edges) - set(H.edges))
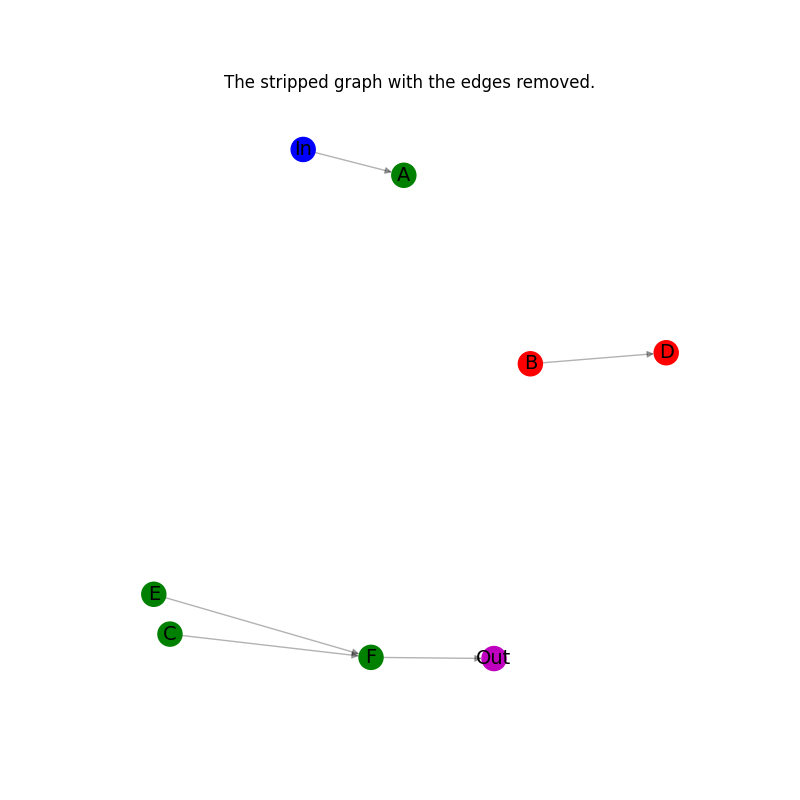
if plotting:
# Plot the stripped graph with the edges removed.
_node_colors = [c for _, c in H.nodes(data="node_color")]
_pos = nx.spring_layout(H)
plt.figure(figsize=(8, 8))
nx.draw_networkx_edges(H, _pos, alpha=0.3, edge_color="k")
nx.draw_networkx_nodes(H, _pos, node_color=_node_colors)
nx.draw_networkx_labels(H, _pos, font_size=14)
plt.axis("off")
plt.title("The stripped graph with the edges removed.")
plt.show()
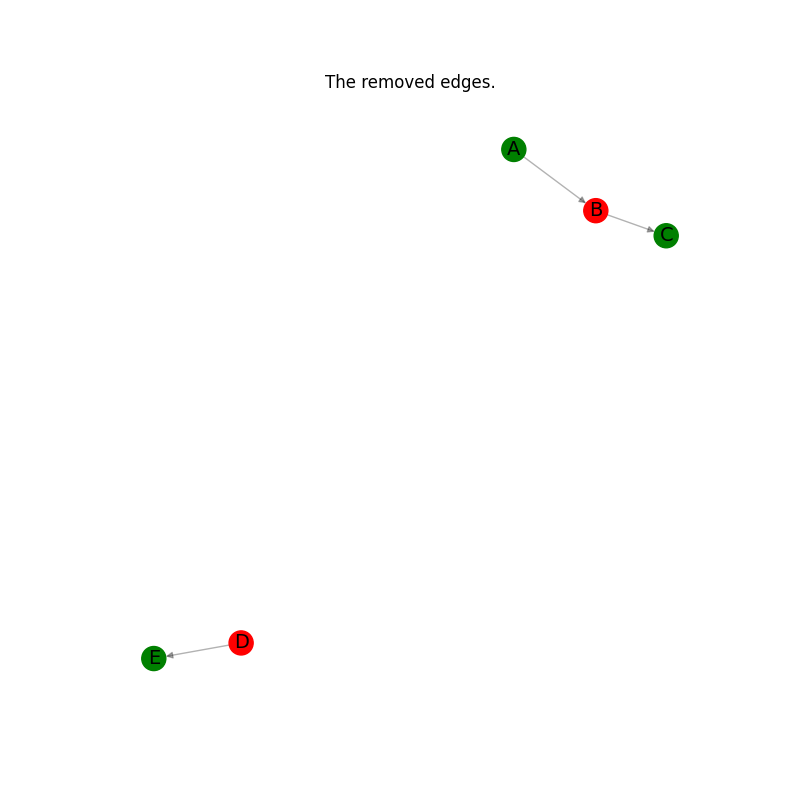
# Plot the the edges removed.
_pos = nx.spring_layout(G_minus_H)
plt.figure(figsize=(8, 8))
ncl = [G.nodes[n]["node_color"] for n in G_minus_H.nodes]
nx.draw_networkx_edges(G_minus_H, _pos, alpha=0.3, edge_color="k")
nx.draw_networkx_nodes(G_minus_H, _pos, node_color=ncl)
nx.draw_networkx_labels(G_minus_H, _pos, font_size=14)
plt.axis("off")
plt.title("The removed edges.")
plt.show()
# Find the connected components in the stripped undirected graph.
# And use the sets, specifying the components, to partition
# the original directed graph into a list of directed subgraphs
# that contain only entirely supported or entirely unsupported nodes.
subgraphs = [
H.subgraph(c).copy() for c in nx.connected_components(H.to_undirected())
]
return subgraphs, G_minus_H
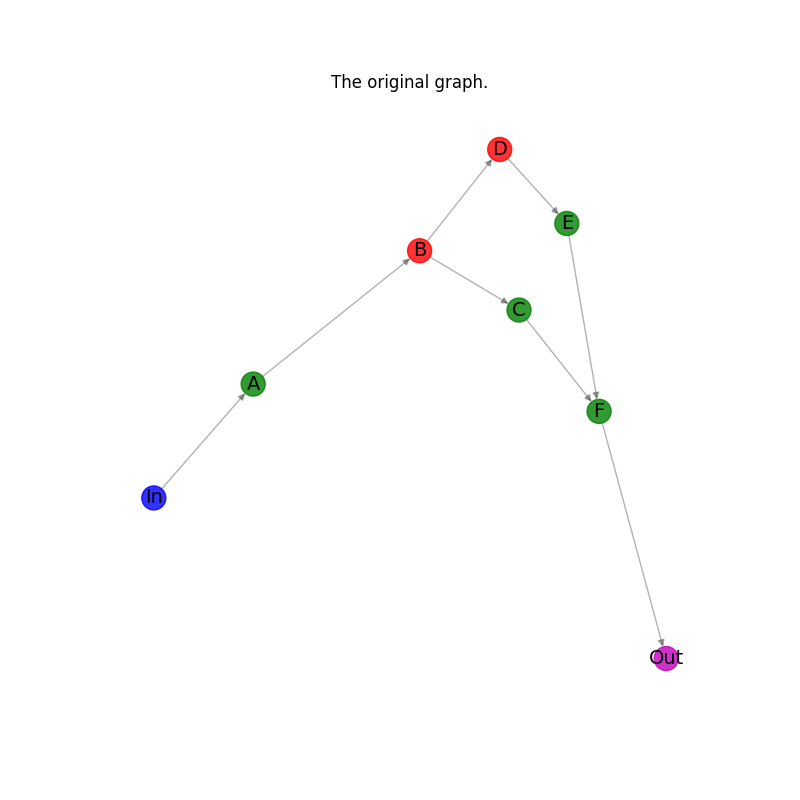
创建一个示例有向图。#
这个有向图有一个输入节点,标记为 in 并以蓝色绘制,一个输出节点标记为 out 并用洋红色标绘。其他六个节点被分类为四个 supported 以绿色和两种颜色绘制 unsupported 以红色标绘。目标是计算一个子图列表,该列表仅包含 supported 或 unsupported 节点。
G_ex = nx.DiGraph()
G_ex.add_nodes_from(["In"], node_type="input", node_color="b")
G_ex.add_nodes_from(["A", "C", "E", "F"], node_type="supported", node_color="g")
G_ex.add_nodes_from(["B", "D"], node_type="unsupported", node_color="r")
G_ex.add_nodes_from(["Out"], node_type="output", node_color="m")
G_ex.add_edges_from(
    [
        ("In", "A"),
        ("A", "B"),
        ("B", "C"),
        ("B", "D"),
        ("D", "E"),
        ("C", "F"),
        ("E", "F"),
        ("F", "Out"),
    ]
)
绘制原始图形。#
node_color_list = [nc for _, nc in G_ex.nodes(data="node_color")]
pos = nx.spectral_layout(G_ex)
plt.figure(figsize=(8, 8))
nx.draw_networkx_edges(G_ex, pos, alpha=0.3, edge_color="k")
nx.draw_networkx_nodes(G_ex, pos, alpha=0.8, node_color=node_color_list)
nx.draw_networkx_labels(G_ex, pos, font_size=14)
plt.axis("off")
plt.title("The original graph.")
plt.show()
通过绘制中间步骤的所有结果来计算子图。#
subgraphs_of_G_ex, removed_edges = graph_partitioning(G_ex, plotting=True)
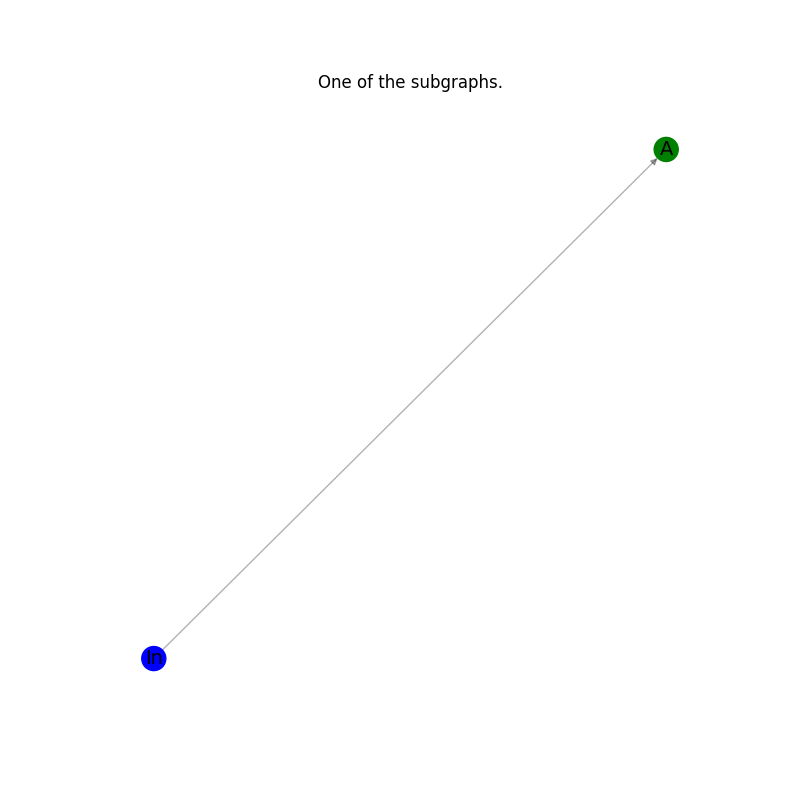
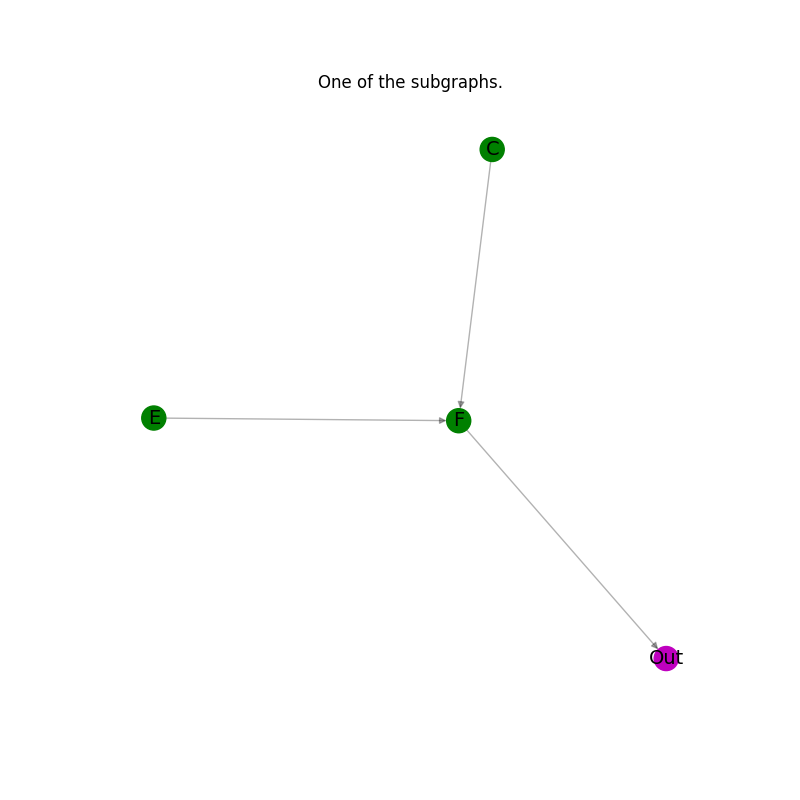
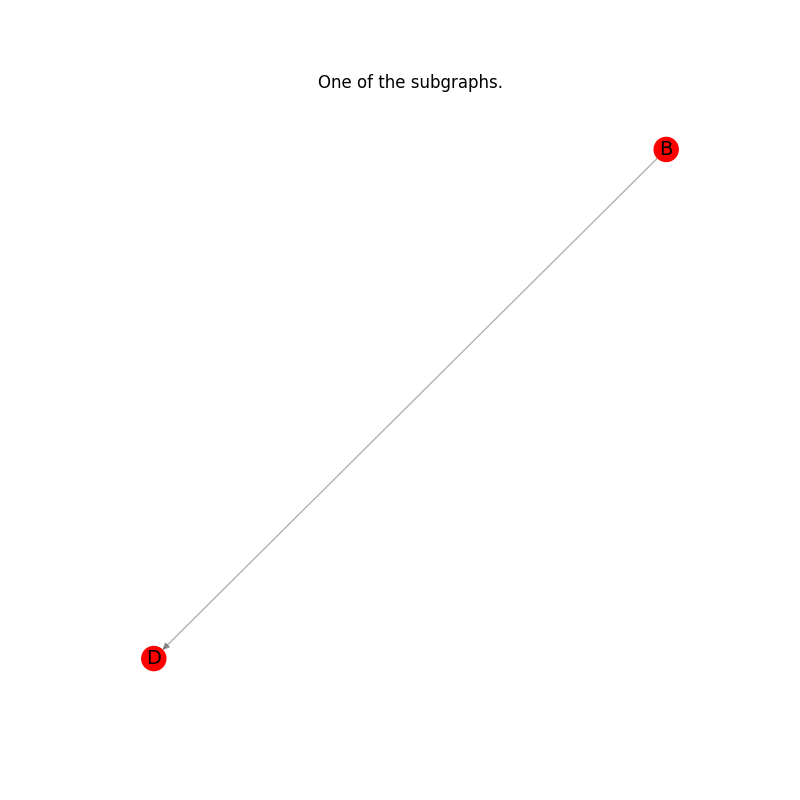
绘制结果:列表中的每个子图。#
for subgraph in subgraphs_of_G_ex:
    _pos = nx.spring_layout(subgraph)
    plt.figure(figsize=(8, 8))
    nx.draw_networkx_edges(subgraph, _pos, alpha=0.3, edge_color="k")
    node_color_list_c = [nc for _, nc in subgraph.nodes(data="node_color")]
    nx.draw_networkx_nodes(subgraph, _pos, node_color=node_color_list_c)
    nx.draw_networkx_labels(subgraph, _pos, font_size=14)
    plt.axis("off")
    plt.title("One of the subgraphs.")
    plt.show()
将该图从子图列表中放回#
G_ex_r = nx.DiGraph()
# Composing all subgraphs.
for subgraph in subgraphs_of_G_ex:
    G_ex_r = nx.compose(G_ex_r, subgraph)
# Adding the previously stored edges.
G_ex_r.add_edges_from(removed_edges.edges())
检查原始图形和重建图形是否同构。#
assert nx.is_isomorphic(G_ex, G_ex_r)
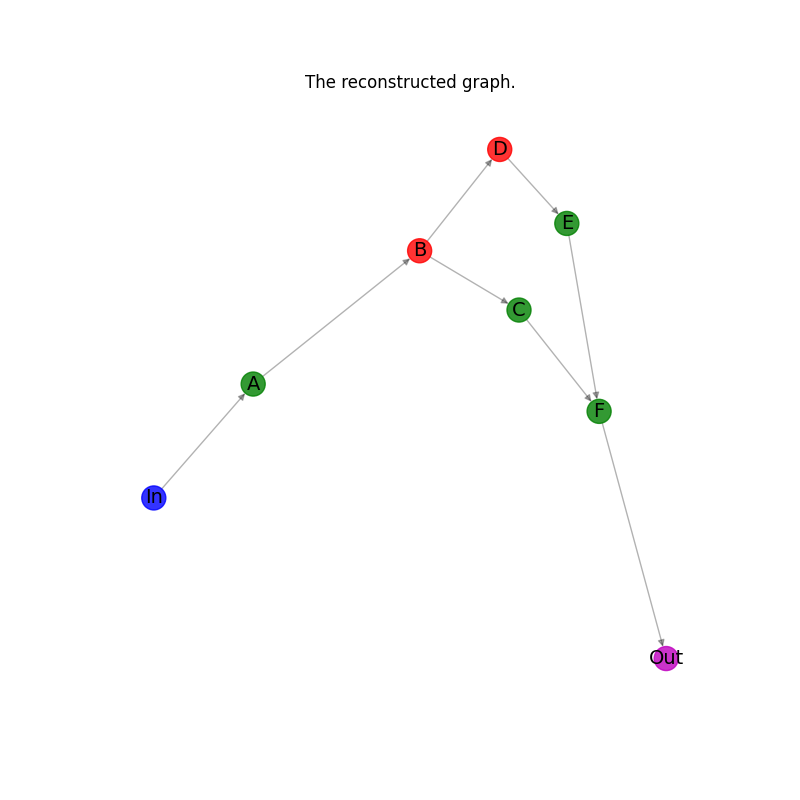
绘制重建的图形。#
node_color_list = [nc for _, nc in G_ex_r.nodes(data="node_color")]
pos = nx.spectral_layout(G_ex_r)
plt.figure(figsize=(8, 8))
nx.draw_networkx_edges(G_ex_r, pos, alpha=0.3, edge_color="k")
nx.draw_networkx_nodes(G_ex_r, pos, alpha=0.8, node_color=node_color_list)
nx.draw_networkx_labels(G_ex_r, pos, font_size=14)
plt.axis("off")
plt.title("The reconstructed graph.")
plt.show()
Total running time of the script: ( 0 minutes 0.510 seconds)