颜色和大小连续的散点图
使用的seaborn组件: set_theme() , load_dataset() , cubehelix_palette() , relplot()
import seaborn as sns
sns.set_theme(style="whitegrid")
# Load the example planets dataset
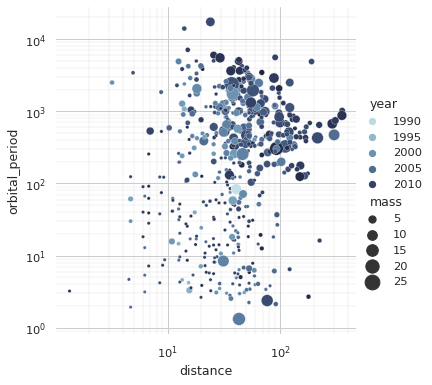
planets = sns.load_dataset("planets")
cmap = sns.cubehelix_palette(rot=-.2, as_cmap=True)
g = sns.relplot(
data=planets,
x="distance", y="orbital_period",
hue="year", size="mass",
palette=cmap, sizes=(10, 200),
)
g.set(xscale="log", yscale="log")
g.ax.xaxis.grid(True, "minor", linewidth=.25)
g.ax.yaxis.grid(True, "minor", linewidth=.25)
g.despine(left=True, bottom=True)