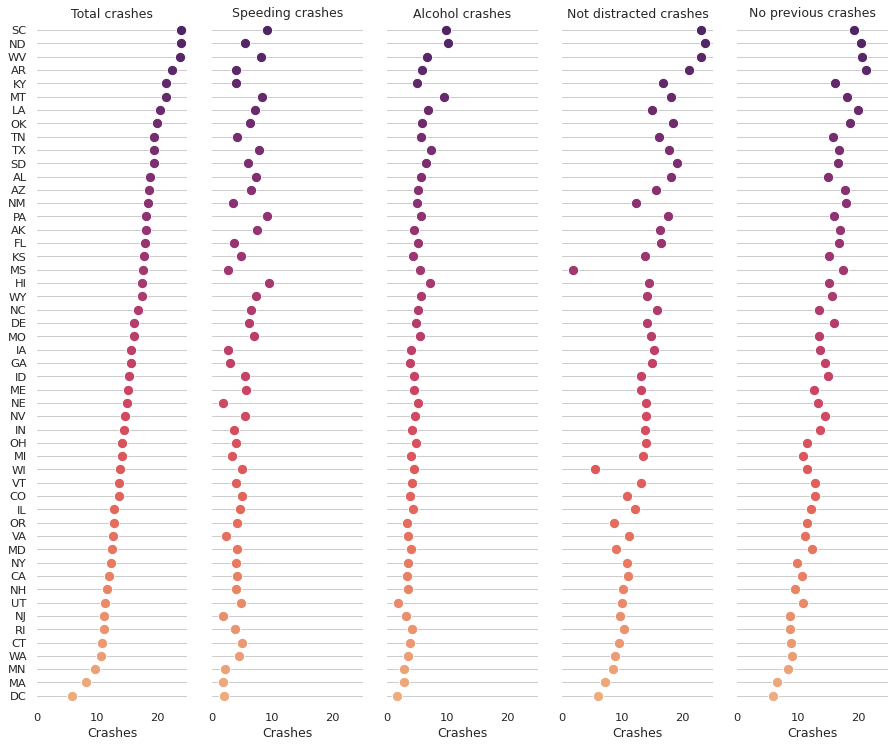
多变量点图
使用的seaborn组件: set_theme() , load_dataset() , PairGrid , despine()
import seaborn as sns
sns.set_theme(style="whitegrid")

# Load the dataset
crashes = sns.load_dataset("car_crashes")

# Make the PairGrid
g = sns.PairGrid(crashes.sort_values("total", ascending=False),
                 x_vars=crashes.columns[:-3], y_vars=["abbrev"],
                 height=10, aspect=.25)

# Draw a dot plot using the stripplot function
g.map(sns.stripplot, size=10, orient="h", jitter=False,
      palette="flare_r", linewidth=1, edgecolor="w")

# Use the same x axis limits on all columns and add better labels
g.set(xlim=(0, 25), xlabel="Crashes", ylabel="")

# Use semantically meaningful titles for the columns
titles = ["Total crashes", "Speeding crashes", "Alcohol crashes",
          "Not distracted crashes", "No previous crashes"]

for ax, title in zip(g.axes.flat, titles):

    # Set a different title for each axes
    ax.set(title=title)

    # Make the grid horizontal instead of vertical
    ax.xaxis.grid(False)
    ax.yaxis.grid(True)

sns.despine(left=True, bottom=True)