联合核密度估计
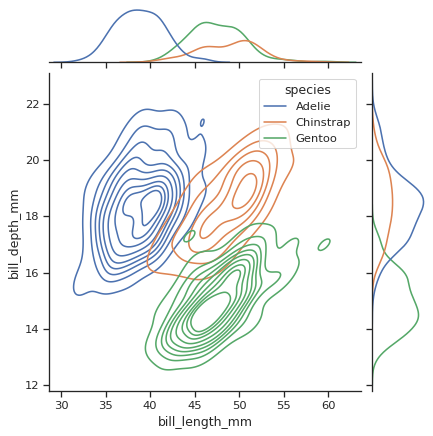
使用的seaborn组件: set_theme() , load_dataset() , jointplot()
import seaborn as sns
sns.set_theme(style="ticks")

# Load the penguins dataset
penguins = sns.load_dataset("penguins")

# Show the joint distribution using kernel density estimation
g = sns.jointplot(
    data=penguins,
    x="bill_length_mm", y="bill_depth_mm", hue="species",
    kind="kde",
)