 Source
备注
单击 here 下载完整的示例代码或通过活页夹在浏览器中运行此示例
阈值设置
阈值处理用于从灰度图像创建二值图像 1.
参见
更全面的介绍 阈值设置
import matplotlib.pyplot as plt
from skimage import data
from skimage.filters import threshold_otsu
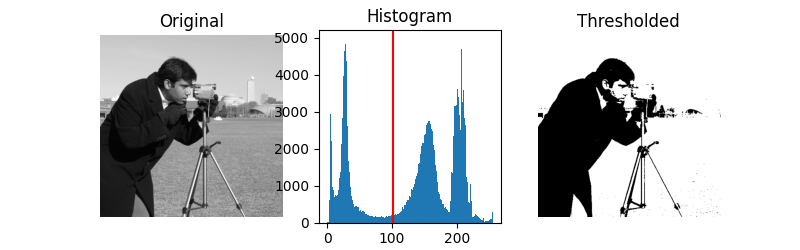
我们举例说明如何应用这些阈值算法之一。大津法 2 通过最大化由阈值分隔的两类像素之间的差异来计算“最佳”阈值(在下面的直方图中用红线标记)。等同地,该阈值最小化了类内方差。
image = data.camera()
thresh = threshold_otsu(image)
binary = image > thresh

fig, axes = plt.subplots(ncols=3, figsize=(8, 2.5))
ax = axes.ravel()
ax[0] = plt.subplot(1, 3, 1)
ax[1] = plt.subplot(1, 3, 2)
ax[2] = plt.subplot(1, 3, 3, sharex=ax[0], sharey=ax[0])

ax[0].imshow(image, cmap=plt.cm.gray)
ax[0].set_title('Original')
ax[0].axis('off')

ax[1].hist(image.ravel(), bins=256)
ax[1].set_title('Histogram')
ax[1].axvline(thresh, color='r')

ax[2].imshow(binary, cmap=plt.cm.gray)
ax[2].set_title('Thresholded')
ax[2].axis('off')

plt.show()
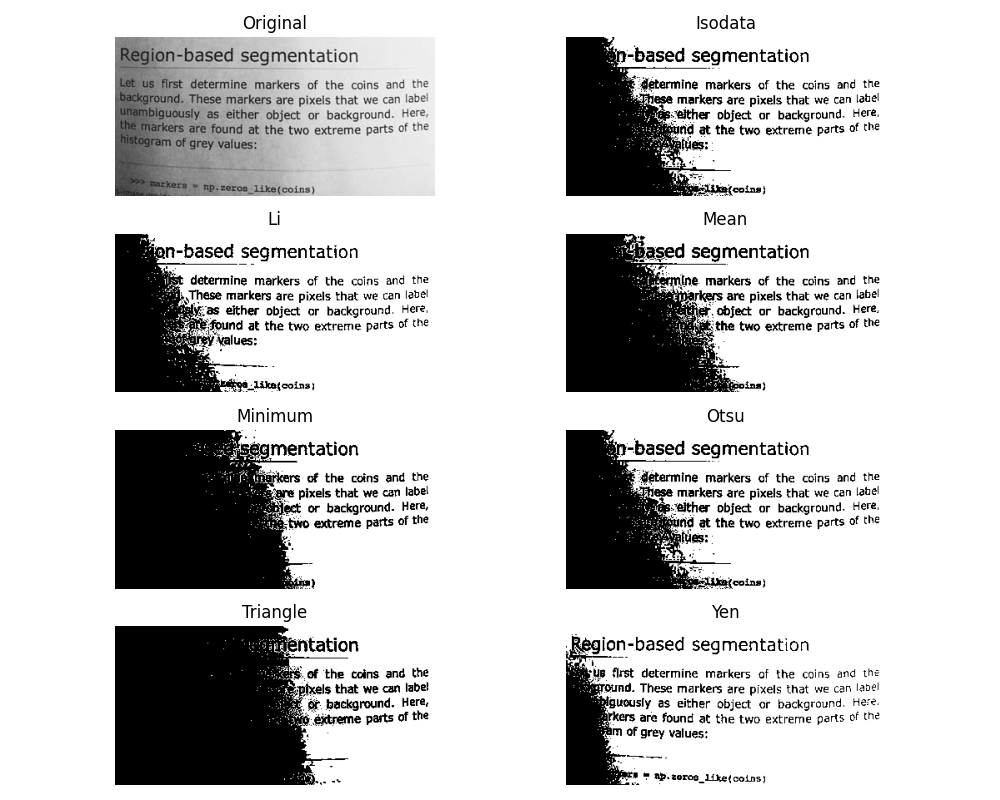
如果您不熟悉不同算法的细节和基本假设,通常很难知道哪种算法将提供最好的结果。因此,Scikit-Image包含了评价库提供的阈值算法的功能。一目了然,您可以为您的数据选择最佳算法,而无需深入了解它们的机制。
脚本的总运行时间: (0分0.586秒)