 Source
备注
单击 here 下载完整的示例代码或通过活页夹在浏览器中运行此示例
区域边界RAG的分层合并
此示例演示了如何对区域边界区域邻接图(RAG)执行分层合并。区域边界碎布可以使用 skimage.future.graph.rag_boundary() 功能。具有最低边权重的区域将被连续合并,直到没有权重小于 thresh 。分层合并是通过 skimage.future.graph.merge_hierarchical() 功能。有关如何构建基于区域边界的RAG的示例,请参见 基于区域边界的RAG 。
from skimage import data, segmentation, filters, color
from skimage.future import graph
from matplotlib import pyplot as plt
def weight_boundary(graph, src, dst, n):
"""
Handle merging of nodes of a region boundary region adjacency graph.
This function computes the `"weight"` and the count `"count"`
attributes of the edge between `n` and the node formed after
merging `src` and `dst`.
Parameters
----------
graph : RAG
The graph under consideration.
src, dst : int
The vertices in `graph` to be merged.
n : int
A neighbor of `src` or `dst` or both.
Returns
-------
data : dict
A dictionary with the "weight" and "count" attributes to be
assigned for the merged node.
"""
default = {'weight': 0.0, 'count': 0}
count_src = graph[src].get(n, default)['count']
count_dst = graph[dst].get(n, default)['count']
weight_src = graph[src].get(n, default)['weight']
weight_dst = graph[dst].get(n, default)['weight']
count = count_src + count_dst
return {
'count': count,
'weight': (count_src * weight_src + count_dst * weight_dst)/count
}
def merge_boundary(graph, src, dst):
"""Call back called before merging 2 nodes.
In this case we don't need to do any computation here.
"""
pass
img = data.coffee()
edges = filters.sobel(color.rgb2gray(img))
labels = segmentation.slic(img, compactness=30, n_segments=400, start_label=1)
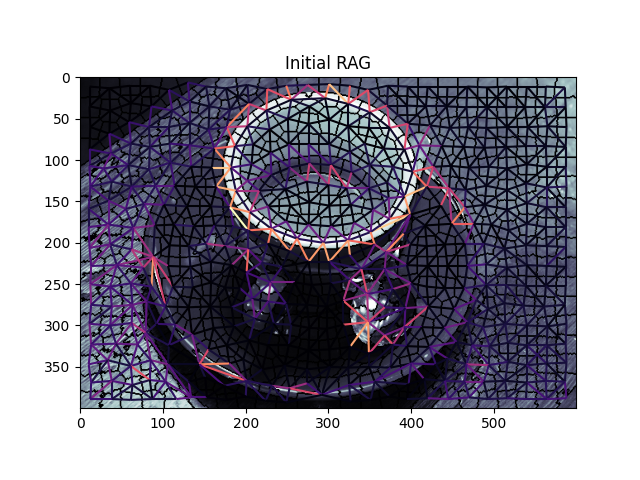
g = graph.rag_boundary(labels, edges)
graph.show_rag(labels, g, img)
plt.title('Initial RAG')
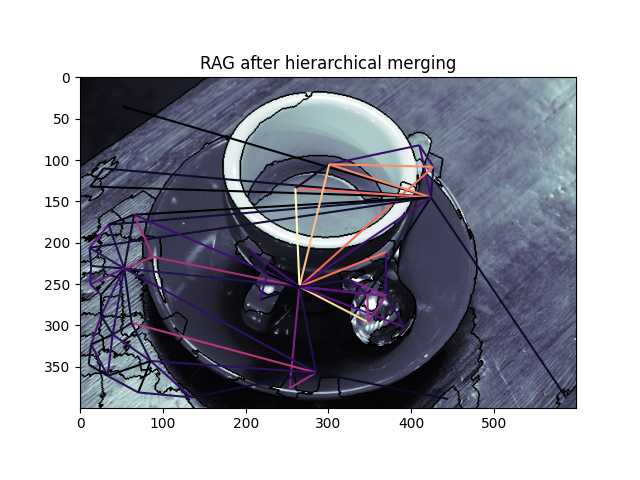
labels2 = graph.merge_hierarchical(labels, g, thresh=0.08, rag_copy=False,
in_place_merge=True,
merge_func=merge_boundary,
weight_func=weight_boundary)
graph.show_rag(labels, g, img)
plt.title('RAG after hierarchical merging')
plt.figure()
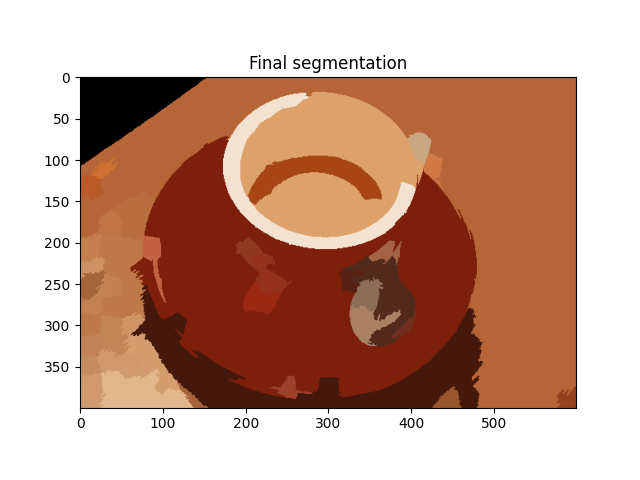
out = color.label2rgb(labels2, img, kind='avg', bg_label=0)
plt.imshow(out)
plt.title('Final segmentation')
plt.show()
脚本的总运行时间: (0分0.899秒)