 Source
备注
单击 here 下载完整的示例代码或通过活页夹在浏览器中运行此示例
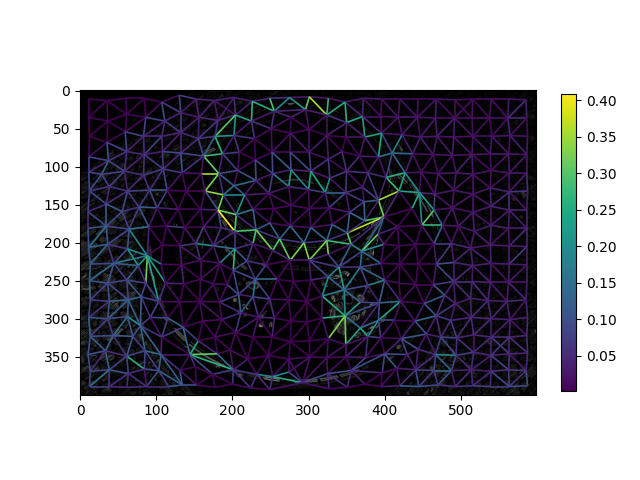
基于区域边界的RAG
使用构造区域边界碎布 rag_boundary 功能。功能 skimage.future.graph.rag_boundary() 需要一个 edge_map 参数,该参数提供每个像素上存在的特征(如边)的重要性。在区域边界RAG中,两个区域之间的边权重是 edge_map 沿着他们的共同边界。
from skimage.future import graph
from skimage import data, segmentation, color, filters, io
from matplotlib import pyplot as plt


img = data.coffee()
gimg = color.rgb2gray(img)

labels = segmentation.slic(img, compactness=30, n_segments=400, start_label=1)
edges = filters.sobel(gimg)
edges_rgb = color.gray2rgb(edges)

g = graph.rag_boundary(labels, edges)
lc = graph.show_rag(labels, g, edges_rgb, img_cmap=None, edge_cmap='viridis',
                    edge_width=1.2)

plt.colorbar(lc, fraction=0.03)
io.show()
脚本的总运行时间: (0分0.593秒)