Matplotlib 0.98.4中的新功能
上一次Matplotlib发布已经四个月了,有很多新特性和错误修复。
感谢Charlie Moad测试和准备源版本,包括OS X的二进制文件和Python 2.4和2.5的Windows(2.6和3.0在这些版本上提供numpy之前不可用)。感谢为本次发布做出贡献的众多开发人员,包括Jae Joon Lee、Michael Droettboom、Ryan May、Eric Filling、Manuel Metz、Jouni K.Sepp_nen、Jeff Whitaker、Darren Dale、David Kaplan、Michiel de Hoon以及许多提交补丁的其他人。
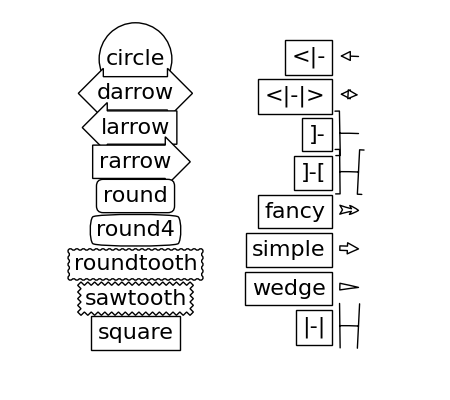
花哨的注释和箭头
JaeJoon为在注释中绘制花哨的方框和连接线增加了很多对注释的支持。见 annotate() 和 BoxStyle , ArrowStyle 和 ConnectionStyle .
(Source code _, png , pdf )
本机OS X后端
Michiel de Hoon提供了一个几乎完全在C中实现的本地Mac OSX后端。因此,后端可以直接使用Quartz,并且根据应用程序的不同,可以比现有后端快几个数量级。此外,除了python和numpy,不需要第三方库。后端使用常规的python从Mac上常见的终端应用程序进行交互。它还没有用ipython测试过,但原则上它也应该在那里工作。在matplotlibrc文件中设置“backend:macosx”,或使用以下命令运行脚本:
> python myfile.py -dmacosx
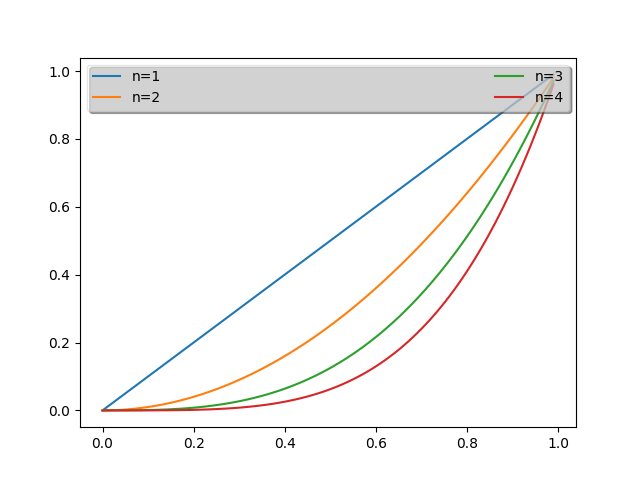
填满
增加了一个 fill_between() 函数的作用是使在有遮罩数据的情况下绘制阴影区域图更容易。你可以通过 x 数组和A 雅罗 和 雅普 要填充的数组,和可选的 在哪里? 参数,它是要在其中进行填充的逻辑掩码。
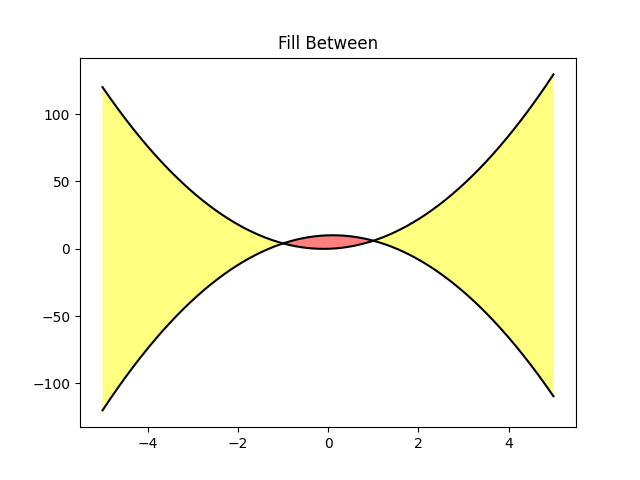
新的98 4填充
更多
以下是变更日志中的0.98.4注释:
Added mdehoon's native macosx backend from sf patch 2179017 - JDH

Removed the prints in the set_*style commands.  Return the list of
pretty-printed strings instead - JDH

Some of the changes Michael made to improve the output of the
property tables in the rest docs broke of made difficult to use
some of the interactive doc helpers, e.g., setp and getp.  Having all
the rest markup in the ipython shell also confused the docstrings.
I added a new rc param docstring.harcopy, to format the docstrings
differently for hardcopy and other use.  The ArtistInspector
could use a little refactoring now since there is duplication of
effort between the rest out put and the non-rest output - JDH

Updated spectral methods (psd, csd, etc.) to scale one-sided
densities by a factor of 2 and, optionally, scale all densities by
the sampling frequency.  This gives better MATLAB
compatibility. -RM

Fixed alignment of ticks in colorbars. -MGD

drop the deprecated "new" keyword of np.histogram() for numpy 1.2
or later.  -JJL

Fixed a bug in svg backend that new_figure_manager() ignores
keywords arguments such as figsize, etc. -JJL

Fixed a bug that the handlelength of the new legend class set too
short when numpoints=1 -JJL

Added support for data with units (e.g., dates) to
Axes.fill_between. -RM

Added fancybox keyword to legend. Also applied some changes for
better look, including baseline adjustment of the multiline texts
so that it is center aligned. -JJL

The transmuter classes in the patches.py are reorganized as
subclasses of the Style classes. A few more box and arrow styles
are added. -JJL

Fixed a bug in the new legend class that didn't allowed a tuple of
coordinate values as loc. -JJL

Improve checks for external dependencies, using subprocess
(instead of deprecated popen*) and distutils (for version
checking) - DSD

Reimplementation of the legend which supports baseline alignment,
multi-column, and expand mode. - JJL

Fixed histogram autoscaling bug when bins or range are given
explicitly (fixes Debian bug 503148) - MM

Added rcParam axes.unicode_minus which allows plain hyphen for
minus when False - JDH

Added scatterpoints support in Legend. patch by Erik Tollerud -
JJL

Fix crash in log ticking. - MGD

Added static helper method BrokenHBarCollection.span_where and
Axes/pyplot method fill_between.  See
examples/pylab/fill_between.py - JDH

Add x_isdata and y_isdata attributes to Artist instances, and use
them to determine whether either or both coordinates are used when
updating dataLim.  This is used to fix autoscaling problems that
had been triggered by axhline, axhspan, axvline, axvspan. - EF

Update the psd(), csd(), cohere(), and specgram() methods of Axes
and the csd() cohere(), and specgram() functions in mlab to be in
sync with the changes to psd().  In fact, under the hood, these
all call the same core to do computations. - RM

Add 'pad_to' and 'sides' parameters to mlab.psd() to allow
controlling of zero padding and returning of negative frequency
components, respectively.  These are added in a way that does not
change the API. - RM

Fix handling of c kwarg by scatter; generalize is_string_like to
accept numpy and numpy.ma string array scalars. - RM and EF

Fix a possible EINTR problem in dviread, which might help when
saving pdf files from the qt backend. - JKS

Fix bug with zoom to rectangle and twin axes - MGD

Added Jae Joon's fancy arrow, box and annotation enhancements --
see examples/pylab_examples/annotation_demo2.py

Autoscaling is now supported with shared axes - EF

Fixed exception in dviread that happened with Minion - JKS

set_xlim, ylim now return a copy of the viewlim array to avoid
modify inplace surprises

Added image thumbnail generating function
matplotlib.image.thumbnail.  See examples/misc/image_thumbnail.py
- JDH

Applied scatleg patch based on ideas and work by Erik Tollerud and
Jae-Joon Lee. - MM

Fixed bug in pdf backend: if you pass a file object for output
instead of a filename, e.g., in a wep app, we now flush the object
at the end. - JKS

Add path simplification support to paths with gaps. - EF

Fix problem with AFM files that don't specify the font's full name
or family name. - JKS

Added 'scilimits' kwarg to Axes.ticklabel_format() method, for
easy access to the set_powerlimits method of the major
ScalarFormatter. - EF

Experimental new kwarg borderpad to replace pad in legend, based
on suggestion by Jae-Joon Lee.  - EF

Allow spy to ignore zero values in sparse arrays, based on patch
by Tony Yu.  Also fixed plot to handle empty data arrays, and
fixed handling of markers in figlegend. - EF

Introduce drawstyles for lines. Transparently split linestyles
like 'steps--' into drawstyle 'steps' and linestyle '--'.  Legends
always use drawstyle 'default'. - MM

Fixed quiver and quiverkey bugs (failure to scale properly when
resizing) and added additional methods for determining the arrow
angles - EF

Fix polar interpolation to handle negative values of theta - MGD

Reorganized cbook and mlab methods related to numerical
calculations that have little to do with the goals of those two
modules into a separate module numerical_methods.py Also, added
ability to select points and stop point selection with keyboard in
ginput and manual contour labeling code.  Finally, fixed contour
labeling bug. - DMK

Fix backtick in Postscript output. - MGD

[ 2089958 ] Path simplification for vector output backends
Leverage the simplification code exposed through path_to_polygons
to simplify certain well-behaved paths in the vector backends
(PDF, PS and SVG).  "path.simplify" must be set to True in
matplotlibrc for this to work.  - MGD

Add "filled" kwarg to Path.intersects_path and
Path.intersects_bbox. - MGD

Changed full arrows slightly to avoid an xpdf rendering problem
reported by Friedrich Hagedorn. - JKS

Fix conversion of quadratic to cubic Bezier curves in PDF and PS
backends. Patch by Jae-Joon Lee. - JKS

Added 5-point star marker to plot command q- EF

Fix hatching in PS backend - MGD

Fix log with base 2 - MGD

Added support for bilinear interpolation in
NonUniformImage; patch by Gregory Lielens. - EF

Added support for multiple histograms with data of
different length - MM

Fix step plots with log scale - MGD

Fix masked arrays with markers in non-Agg backends - MGD

Fix clip_on kwarg so it actually works correctly - MGD

Fix locale problems in SVG backend - MGD

fix quiver so masked values are not plotted - JSW

improve interactive pan/zoom in qt4 backend on windows - DSD

Fix more bugs in NaN/inf handling.  In particular, path
simplification (which does not handle NaNs or infs) will be turned
off automatically when infs or NaNs are present.  Also masked
arrays are now converted to arrays with NaNs for consistent
handling of masks and NaNs - MGD and EF

Added support for arbitrary rasterization resolutions to the SVG
backend. - MW